Autograph is an easy-to-use digital signature software that allows you to electronically sign PDF documents. It has features like SMS and email signature workflow, bulk sending documents for signature, and signer identity verification.
Autograph is an easy-to-use digital signature software that allows you to electronically sign PDF documents. It has features like SMS and email signature workflow, bulk sending documents for signature, and signer identity verification.
What is Autograph?
Autograph is software designed specifically for applying digital signatures to documents. It allows individuals and teams to sign PDFs, Word documents, and other file types electronically.
Some key features of Autograph include:
Intuitive drag-and-drop interface for adding signatures to PDFs
Role-based signing workflows with sequential or parallel routing options
Bulk sending of documents for signature from desktop or directly within other business apps
Legally-binding digital signatures with timestamping and tamper-evident seals
Sms and email reminder notifications to signers with document expiry settings
Identity verification of signers through SMS, phone, and knowledge-based authentication
Audit trails showing signing activity and event logs
Customizable branding options and white labeling capabilities
Integrations with popular business platforms like Google Workspace, Office 365, and Salesforce
Overall, Autograph aims to make digital document signing fast, efficient, fully secure, and aligned to business needs. It's suitable for companies and teams looking to reduce paper-based signatures and transition fully to eSignatures and digital transaction management.
Autograph Features
Features
Electronic PDF signature
SMS and email signature workflow
Bulk sending documents for signature
Signer identity verification
Pricing
Freemium
Subscription-Based
Pros
Easy to use
Secure digital signatures
Streamlines document signing process
Verifies signer identity
Cons
Limited customization options
Requires internet connection for full functionality
May not integrate with all document management systems
OriginPro is a powerful data analysis and graphing software designed for scientists, engineers, and analysts across various industries. It is developed by OriginLab Corporation for analyzing, graphing, and presenting scientific data.Some of the key features of OriginPro include:An extensive selection of analysis tools like peak analysis, surface fitting, statistics, signal...
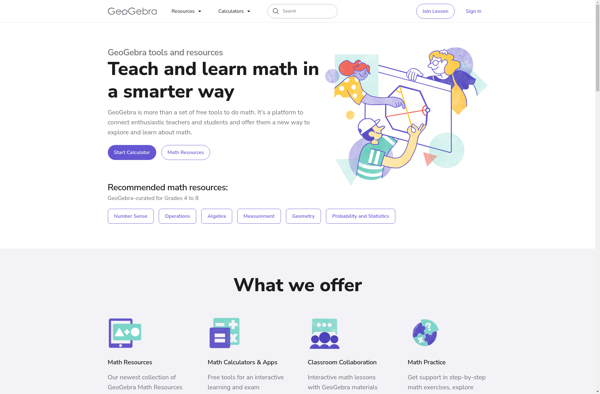
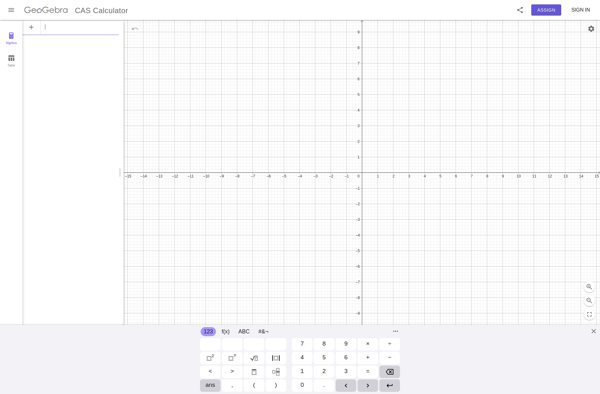
GeoGebra is a free, open-source dynamic mathematics software that can be used for teaching and learning mathematics at all levels of education. It combines geometry, algebra, spreadsheets, graphing, statistics and calculus in one easy-to-use and well-integrated package making it an excellent tool for demonstrating mathematical concepts.Some of the key features...
GnuPlot is a powerful, stable and free scientific graphing package with advanced capabilities. Developed originally for Unix-like operating systems, GnuPlot is now available for Windows, macOS and Linux.It can produce high-quality graphical visualizations of data from files or stdin, including simple x-y plots, histograms, contour plots, mesh plots, polar plots,...
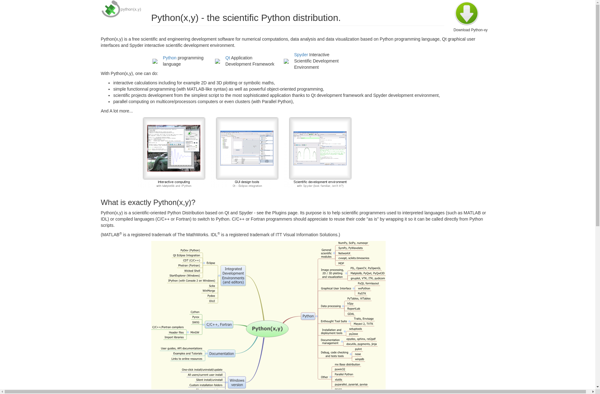
python(x,y) is an open-source mathematical plotting and data visualization library for the Python programming language. It is designed to be simple, efficient, and highly customizable. python(x,y) provides a MATLAB-like interface for creating a wide range of 2D plots, including line plots, scatter plots, histograms, bar charts, pie charts, error bars,...
SciDaVis is a cross-platform computer program for numerical analysis and data visualization. It is designed to be compatible with OriginLab Origin software in terms of analysis capabilities and interface, while being free and open-source.Some key features of SciDaVis include:Interactive 2D and 3D plotting from imported dataA wide variety of 2D...
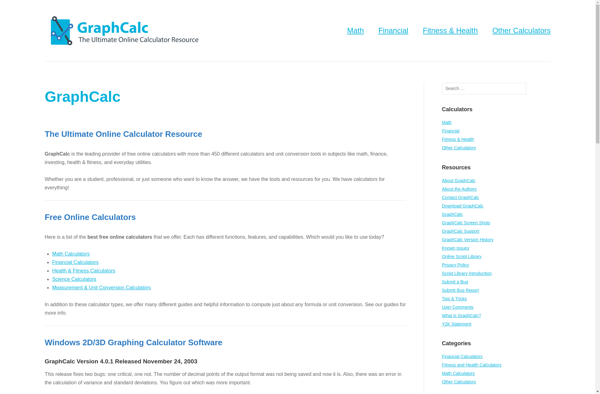
GraphCalc is a feature-rich graphical calculator software application aimed primarily at high school and college students studying math and science. It allows users to easily plot a wide variety of 2D and 3D functions and visualize them interactively in order to gain deeper mathematical understanding.Key features of GraphCalc include:Intuitive graphical...
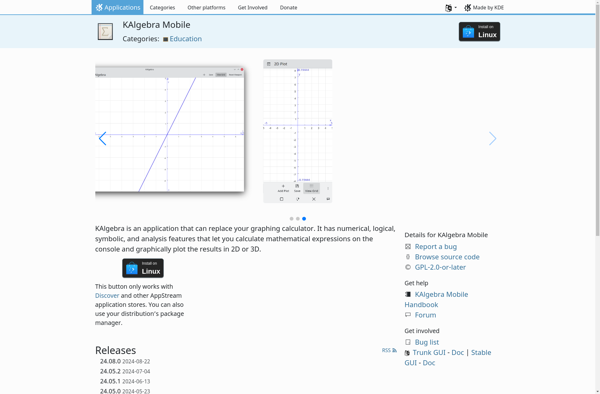
KAlgebra is a free, open-source educational mathematics software with a focus on algebra, geometry and calculus. It provides a graphical interface and computational tools for working with equations, functions, graphs, vectors, matrices and more.Some key features of KAlgebra include:Interactive 2D and 3D graphing with zoom/pan capabilitiesStep-by-step equation solver for algebra...
KSEG is an open-source software that serves as both a waveform generator and oscilloscope for Linux systems. It provides a user-friendly graphical interface that allows users to easily generate various waveforms including sine, square, triangle, sawtooth, as well as arbitrary/user defined waveforms. Some key features of KSEG include:Generate waveforms with...
Matplotlib is a comprehensive 2D plotting library for Python that enables users to create a wide variety of publication-quality graphs, charts, and visualizations. It supports many basic and advanced plotting functionalities and integrates well with NumPy and Pandas data structures.Matplotlib can be used to visualize data in a variety of...
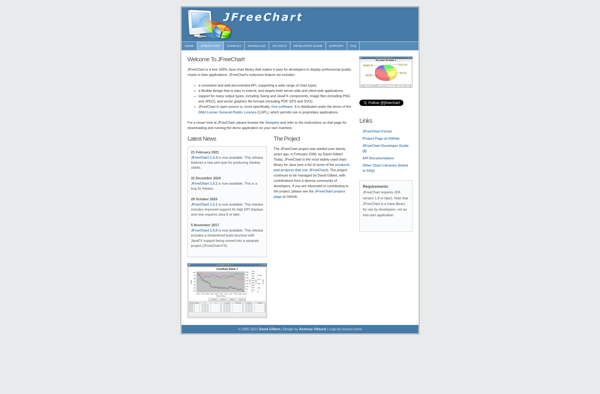
JFreeChart is a feature-rich, free Java chart library that enables developers to add impressive charts and graphs to their Java applications. Originally created by David Gilbert in 2000, JFreeChart has grown to become one of the most widely used Java charting solutions.Some key capabilities and benefits of JFreeChart include:Open-source library...
Giac/Xcas is a powerful, open-source computer algebra system (CAS) used for symbolic computation in mathematics, science, and engineering. It offers capabilities for symbolic calculations, solving equations, simplifying algebraic expressions, differentiation and integration, 2D/3D plotting, statistics, and more.Some key features and capabilities of Giac/Xcas include:Symbolic manipulation of mathematical expressions and formulasNumerical...
Dash Reports is a business intelligence and data visualization software used by organizations to connect to data sources like databases, cloud apps, and files, and build interactive reports and dashboards that provide actionable insights. Some key features of Dash Reports include:Intuitive drag-and-drop interface that makes it easy for non-technical users...
GeoGebra is a free, multi-platform dynamic mathematics software that joins geometry, algebra, tables, graphing, statistics and calculus in one easy-to-use package. It can be used for all levels of mathematics education from elementary through university level. Some of the key features of GeoGebra include:Graphing functions, inequalities, conic sectionsDynamic geometric constructions,...
MagicPlot Viewer is a free standalone application developed by MagicPlot Inc. to view MagicPlot project files (.mpprj) without needing a full MagicPlot license. It provides core visualization and analysis capabilities to open existing plots, charts, equations and fitted data created with the MagicPlot software.Key features of MagicPlot Viewer include:Opens MagicPlot...
Mandela is an open-source project management and task tracking application similar to Asana. It allows teams to plan projects, assign tasks, set due dates, add comments and attachments, and view project progress on timeline boards.Some key features of Mandela include:Boards to organize tasks and projects into columnsLists and cards for...