Dash Reports
Dash Reports: Business Intelligence and Reporting Softwares
A business intelligence software with drag-and-drop functionality, allowing easy report building for non-technical users, connect to data sources and share insights.
What is Dash Reports?
Dash Reports is a business intelligence and data visualization software used by organizations to connect to data sources like databases, cloud apps, and files, and build interactive reports and dashboards that provide actionable insights. Some key features of Dash Reports include:
- Intuitive drag-and-drop interface that makes it easy for non-technical users to build reports and dashboards without coding
- Options to create different types of reports including tabular, matrix, chart, pivot table, gauge reports etc.
- Ability to connect to a wide variety of data sources such as SQL, MySQL, Postgres, Excel, CSV etc.
- Customizable dashboards that allow users to see multiple reports in one view for better data analysis
- Interactive visualization with features like drill down, slicing and dicing data, filtering etc.
- Scheduling and distribution capabilities to share reports via email, portals, apps or embed into websites
- Role based access control for managing users and security
- On-premises and cloud deployment options available
With an easy-to-use interface and broad data connectivity, Dash Reports enables organizations to efficiently access, analyze and share data for smarter decision making and giving teams self-service access to reports.
Dash Reports Features
Features
- Drag-and-drop interface for building reports and dashboards
- Connects to a variety of data sources like SQL, Salesforce, Excel, etc.
- Has pre-built templates and themes for reports and dashboards
- Allows data blending from multiple sources
- Has scheduling and distribution capabilities
- Offers interactive visualization options like charts, graphs, gauges, maps, etc.
- Provides role-based access control and sharing
- Mobile optimization of reports and dashboards
- Ad-hoc reporting capabilities
- Alerts and notifications
Pricing
- Freemium
- Subscription-Based
Pros
Cons
Official Links
Reviews & Ratings
Login to ReviewThe Best Dash Reports Alternatives
View all Dash Reports alternatives with detailed comparison →
Top Business & Commerce and Business Intelligence & Analytics and other similar apps like Dash Reports
Here are some alternatives to Dash Reports:
Suggest an alternative ❐GnuPlot

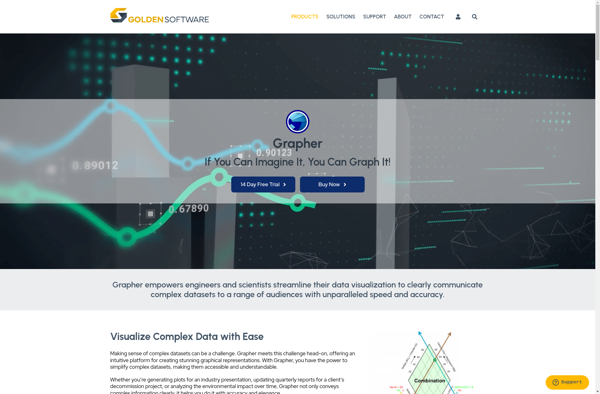
Golden Software Grapher
Graphmatica
Matplotlib

JFreeChart
Autograph