Golden Software Grapher
Golden Software Grapher: Scientific Graphing and Data Visualization
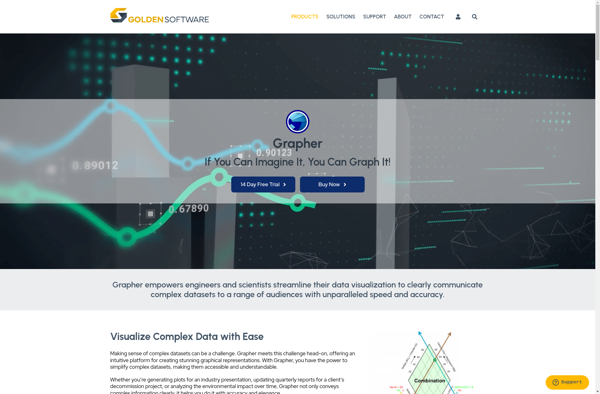
Golden Software Grapher is a 2D and 3D scientific graphing and data visualization software. It allows users to easily create a wide variety of graphs and charts and customize them. Grapher can handle large complex datasets and has capabilities like contouring and surface mapping.
What is Golden Software Grapher?
Golden Software Grapher is a powerful 2D and 3D scientific data visualization application. It enables users to create a wide variety of graphs and charts to represent complex data sets, including specialized plots like contour, vector, watershed, pie, bar, scatter, polar, ternary, statistical graphs and many more.
Grapher excels at handling large, complex datasets with ease. It has versatile import and export options, allowing data to be brought in from Excel, text files, online sources, and other applications. Visualization options like contours, shaded relief, overlays, fittings, thermoclines help users gain deeper insights.
Key features include:
- Intuitive interface to create 2D and 3D graphs quickly
- Hundreds of graph types including line, spline, step, bubble, bar, area, pie, scatter, etc
- Powerful customization options for colors, styles, fonts, layouts
- Capability to handle large complex datasets with millions of points smoothly
- Contouring, thermoclines, vector plots, watershed and ecosystem mapping capabilities
- Automation through scripts and command line control
- Seamless integration with Surfer for advanced mapping
With its balance of usability and advanced visualization tools, Grapher is a versatile data analysis and communication tool for researchers, engineers, analysts and businesses across industries like geosciences, biosciences, energy, finance and more.
Golden Software Grapher Features
Features
- 2D and 3D graphing
- Large dataset handling
- Contouring and surface mapping
- Customizable graphs and charts
- Variety of graph types supported
- Data analysis tools
- Exporting and sharing graphs
Pricing
- One-time Purchase
- Subscription-Based
Pros
Cons
Reviews & Ratings
Login to ReviewThe Best Golden Software Grapher Alternatives
View all Golden Software Grapher alternatives with detailed comparison →
Top Science & Engineering and Data Visualization and other similar apps like Golden Software Grapher
Here are some alternatives to Golden Software Grapher:
Suggest an alternative ❐OriginPro

GeoGebra

GnuPlot

NumeRe

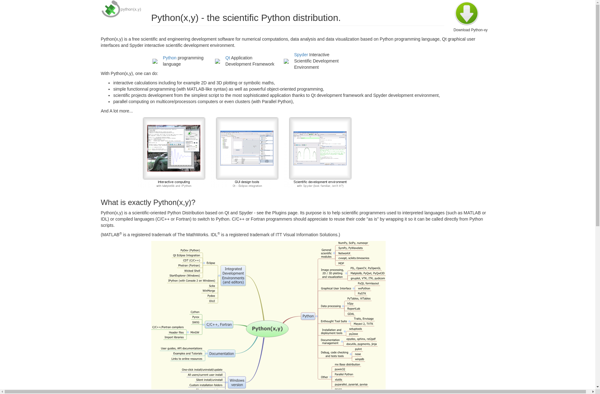
Python(x,y)
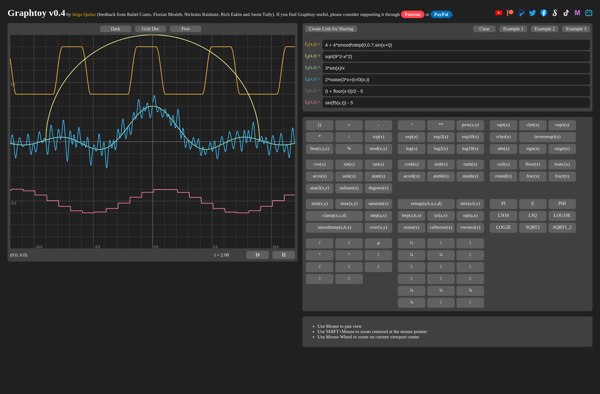
Graph Toy
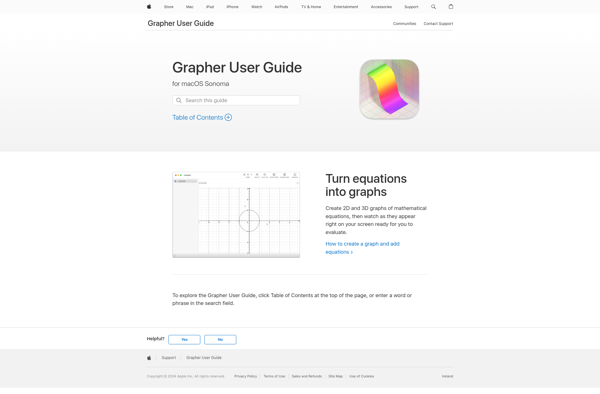
Grapher
SciDaVis

Graphtoy
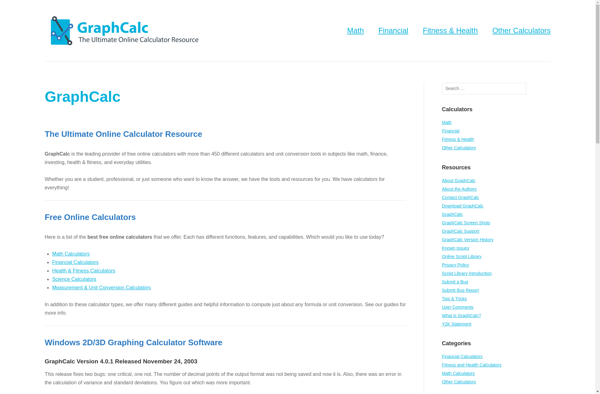
GraphCalc
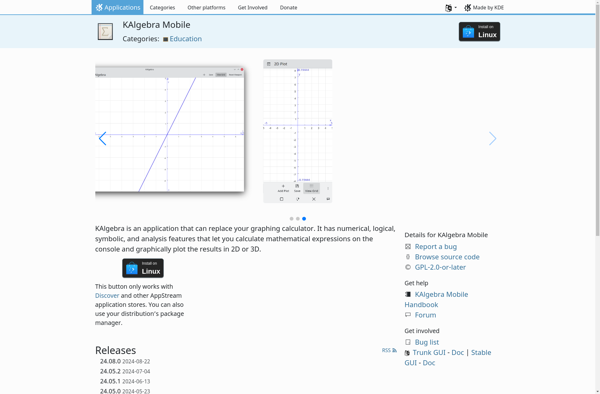
KAlgebra
KSEG
Matplotlib

JFreeChart
Giac/Xcas