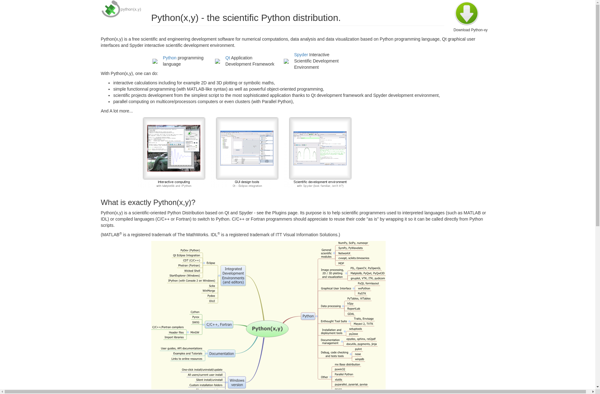
python(x,y) is an open-source mathematical plotting and data visualization library for the Python programming language. It provides a simple interface for creating 2D plots, histograms, power spectra, bar charts, errorcharts, contour plots, etc.
python(x,y): Open-Source Math Plotting and Data Visualization
python(x,y) is an open-source mathematical plotting and data visualization library for the Python programming language. It provides a simple interface for creating 2D plots, histograms, power spectra, bar charts, errorcharts, contour plots, etc.
What is Python(x,y)?
python(x,y) is an open-source mathematical plotting and data visualization library for the Python programming language. It is designed to be simple, efficient, and highly customizable. python(x,y) provides a MATLAB-like interface for creating a wide range of 2D plots, including line plots, scatter plots, histograms, bar charts, pie charts, error bars, box plots, etc. Some key features include:
Simple and intuitive object-oriented interface
Support for NumPy arrays for fast plotting of numeric data
A wide range of plot customization options such as linestyles, markers, colors, etc.
High-quality output in many formats (PDF, PNG, SVG, etc.)
Extensions for 3D and polar plotting, statistics, image processing, and more
Gallery with examples ranging from simple plots to complex visualizations
Integration with all major Python scientific computing libraries
python(x,y) is designed to provide publication-ready figures with minimum effort. The simple interface hides the complexity of lower-level graphics libraries, freeing the user to focus on data visualization rather than programming details. Its modular structure and plugin architecture allow extensive expansion into specialized plotting requirements. python(x,y) runs on all major operating systems and is free for use in both academic and commercial settings.
GeoGebra is a free, open-source dynamic mathematics software that can be used for teaching and learning mathematics at all levels of education. It combines geometry, algebra, spreadsheets, graphing, statistics and calculus in one easy-to-use and well-integrated package making it an excellent tool for demonstrating mathematical concepts.Some of the key features...
GnuPlot is a powerful, stable and free scientific graphing package with advanced capabilities. Developed originally for Unix-like operating systems, GnuPlot is now available for Windows, macOS and Linux.It can produce high-quality graphical visualizations of data from files or stdin, including simple x-y plots, histograms, contour plots, mesh plots, polar plots,...
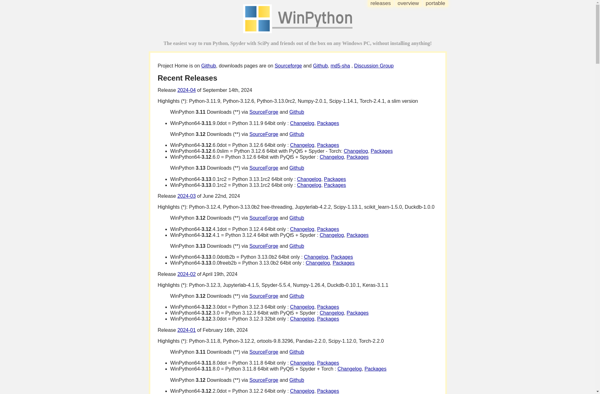
WinPython is a free open-source portable distribution of the Python programming language and scientific Python packages for Windows. It aims to provide everything you need for data science in one convenient bundle that works out of the box.WinPython comes preinstalled with over 100 of the most popular Python packages for...
Grapher is a powerful 2D and 3D graphing utility developed by Apple Inc. and included with macOS. It allows users to visualize a wide variety of data sets, equations, geometric shapes, scalar/vector fields in 2D and 3D, and more. Some key features of Grapher include:Intuitive interface for entering equations and...
SciDaVis is a cross-platform computer program for numerical analysis and data visualization. It is designed to be compatible with OriginLab Origin software in terms of analysis capabilities and interface, while being free and open-source.Some key features of SciDaVis include:Interactive 2D and 3D plotting from imported dataA wide variety of 2D...
Golden Software Grapher is a powerful 2D and 3D scientific data visualization application. It enables users to create a wide variety of graphs and charts to represent complex data sets, including specialized plots like contour, vector, watershed, pie, bar, scatter, polar, ternary, statistical graphs and many more.Grapher excels at handling...
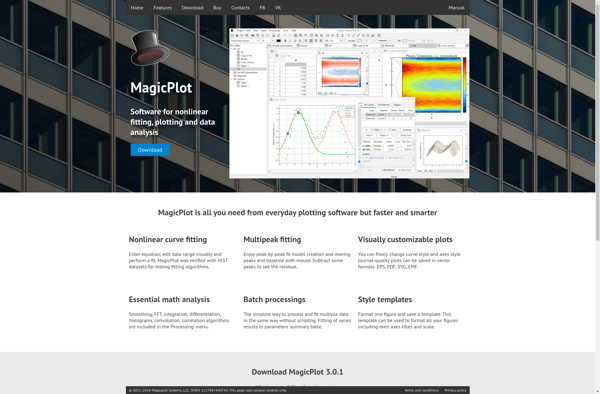
MagicPlot is a versatile software tool designed for scientific data analysis and publication-quality visualization. It runs on Windows, macOS, and Linux.With MagicPlot, users can import data from files or external sources, manipulate and analyze it, and create a wide variety of 2D and 3D graphs and charts. Its key features...
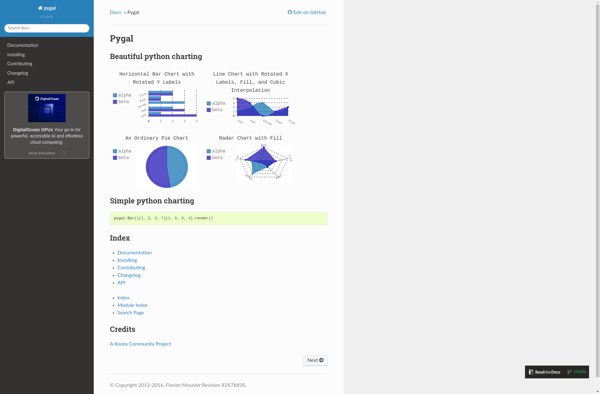
Pygal is an open-source Python charting library that provides tools to build interactive SVG charts and graphs from data. Some of the key features and capabilities of Pygal include:Support for various common chart types including bar charts, pie charts, line charts, xy charts, radar charts, box plots, dot plots etc.Highly...
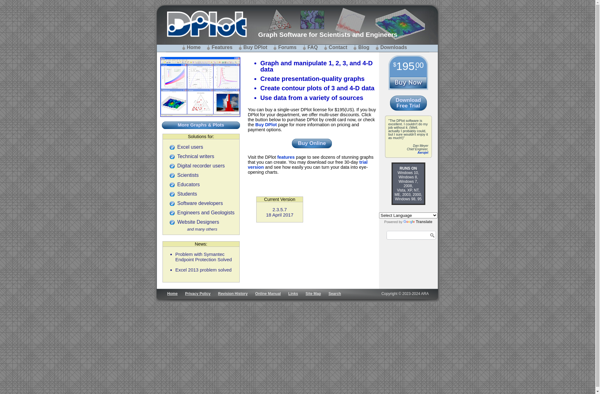
DPlot is an open-source, cross-platform application designed for interactive scientific data visualization and analysis. It features a user-friendly graphical interface that allows users to easily create 2D and 3D plots, fit data to both linear and non-linear models, perform statistical analysis, and customize graph attributes.Some key features of DPlot include:Support...
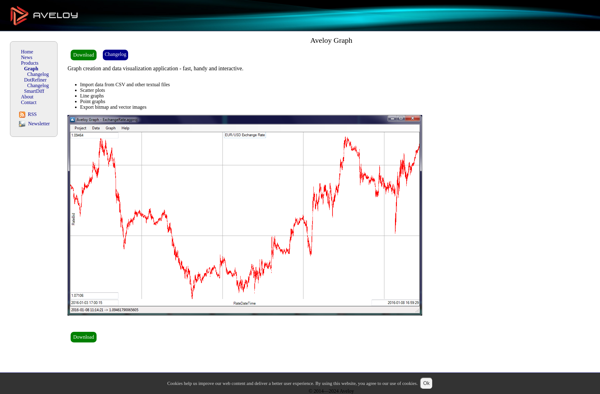
Aveloy Graph is a no-code business intelligence analytics and visualization software for building interactive dashboards. It provides an intuitive way for users of all skill levels to visualize data and create shareable analytics.With Aveloy Graph, users can connect data from multiple sources including MySQL, PostgreSQL, MongoDB, Excel, CSV files, and...
Graphmatica is a powerful, user-friendly software application for visualizing and analyzing complex network graphs. Developed by an international team of researchers and programmers, Graphmatica is offered completely free of charge under an open-source license.With an intuitive graphical interface, Graphmatica makes it easy to import network data from standard file formats...
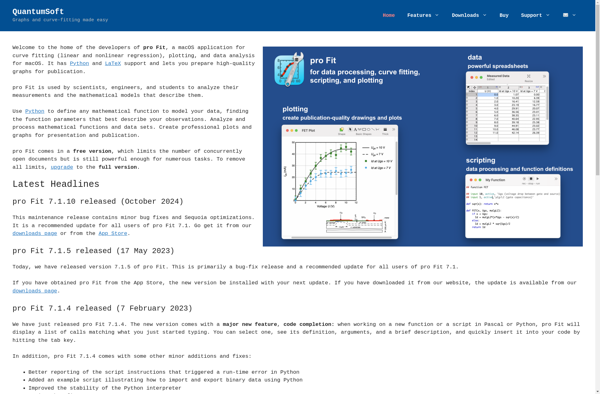
pro Fit is a popular workout and fitness tracking mobile app available for iOS and Android. It allows users to log various types of exercises including strength training, cardio, yoga, pilates, and more. Key features of pro Fit include:Exercise database with 1300+ exercises covering all major muscle groupsCustomizable fitness routines...
Matplotlib is a comprehensive 2D plotting library for Python that enables users to create a wide variety of publication-quality graphs, charts, and visualizations. It supports many basic and advanced plotting functionalities and integrates well with NumPy and Pandas data structures.Matplotlib can be used to visualize data in a variety of...
Portable Python is a portable version of the Python programming language and environment that can run directly off a USB flash drive or external hard drive without needing to be installed on the host computer. It provides a convenient way to take Python with you and run your Python programs...
Magma is an open-source, cross-platform software for solving problems in engineering and mathematical physics. It is specialized in numerical solutions using the finite element method, with a particular focus on electromagnetic, thermal, and mechanical simulations.Some key capabilities and applications of Magma include:Modeling electromagnetic wave propagation, scattering, and radiation problems. This...
Lybniz is a free, open-source graphing calculator software for Windows, Linux and macOS operating systems. It provides an intuitive graphical user interface for drawing mathematical equations, functions and graphs on screen. As equations are typed or drawn with the mouse, Lybniz dynamically plots the corresponding graph, allowing for visualization and...
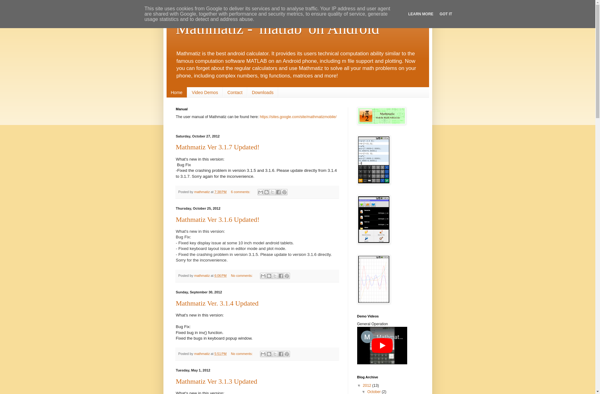
Mathmatiz is a free and open-source software designed for mathematics education. It includes features found in general graphing calculators as well as specialized mathematical tools.Mathmatiz allows students to visualize mathematical concepts through 2D and 3D graphing. It can graph a wide variety of functions and equations. The graphs can be...
Autograph is software designed specifically for applying digital signatures to documents. It allows individuals and teams to sign PDFs, Word documents, and other file types electronically.Some key features of Autograph include:Intuitive drag-and-drop interface for adding signatures to PDFsRole-based signing workflows with sequential or parallel routing optionsBulk sending of documents for...
Enthought is a software company founded in 2001 that focuses on developing Python solutions for scientific and analytic computing. Their products and services center around enabling organizations to build and deploy robust Python environments for data science, machine learning, and scientific computing.Enthought's flagship product is the Enthought Deployment Manager, which...
ScicosLab is an open-source software suite for numerical computation that specializes in the modeling and simulation of dynamical systems. It features a user-friendly graphical interface based on block diagrams, allowing users to easily construct models by dragging and dropping blocks representing system components.Some of the key capabilities and features of...
GeoGebra is a free, multi-platform dynamic mathematics software that joins geometry, algebra, tables, graphing, statistics and calculus in one easy-to-use package. It can be used for all levels of mathematics education from elementary through university level. Some of the key features of GeoGebra include:Graphing functions, inequalities, conic sectionsDynamic geometric constructions,...
Core Plot is an open-source, 2D plotting framework for macOS, iOS, and tvOS applications. It enables developers to easily create high-performance, publication-quality graphs and charts for inclusion in native Mac, iPhone, iPad, and Apple TV apps.Some key capabilities and benefits of Core Plot include:High-performance rendering, with full support for large...
Reinteract is an open-source customer engagement platform designed to help companies have more meaningful conversations with customers. It provides a suite of tools to:Centralize customer data from multiple sources into one databaseBuild customer profiles and segments to understand customers betterSet up automated, personalized marketing campaigns across email, mobile push, SMS,...
MagicPlot Viewer is a free standalone application developed by MagicPlot Inc. to view MagicPlot project files (.mpprj) without needing a full MagicPlot license. It provides core visualization and analysis capabilities to open existing plots, charts, equations and fitted data created with the MagicPlot software.Key features of MagicPlot Viewer include:Opens MagicPlot...
Mathomatic is a free and open-source computer algebra system (CAS) software designed for symbolic mathematics and numerical calculations. Developed in portable C, Mathomatic can run on various platforms like Linux, Windows, macOS, and Unix.Mathomatic provides a simple yet powerful environment to perform a wide range of mathematical operations seamlessly. It...