GnuPlot

GnuPlot: Free Graphing Utility
GnuPlot is a free, open-source graphing utility that can produce publication-quality 2D and 3D plots. It supports various plot types like line, scatter, histogram, boxplot, and contour plots. GnuPlot can also fit and manipulate data.
What is GnuPlot?
GnuPlot is a powerful, stable and free scientific graphing package with advanced capabilities. Developed originally for Unix-like operating systems, GnuPlot is now available for Windows, macOS and Linux.
It can produce high-quality graphical visualizations of data from files or stdin, including simple x-y plots, histograms, contour plots, mesh plots, polar plots, bar charts, errorbars, boxplots, heatmaps, surface maps and many more. Plots can be customized extensively with labels, legends, titles, axes styles, line styles and other attributes.
GnuPlot supports various data formats like CSV, XML, JSON and can also fetch data directly from databases or call external programs. It offers automation capabilities with scripting in its own domain-specific language, as well batch/non-interactive execution.
GnuPlot outputs plots in several bitmap and vector formats like PNG, JPEG, SVG, PDF, PostScript etc. These plots can be embedded into LaTeX, Html or included in presentations and publications.
With its advanced math and stats functionality, excellent documentation and active community support, GnuPlot remains a popular choice for scientific visualization, data analysis and simulation across domains like engineering, physics, mathematics, economics and more.
GnuPlot Features
Features
- 2D and 3D plotting
- Supports various plot types like line, scatter, histogram, boxplot, contour
- Data fitting and manipulation
- Publication quality output
- Scriptable using its own domain specific language
Pricing
- Open Source
Pros
Cons
Official Links
Reviews & Ratings
Login to ReviewThe Best GnuPlot Alternatives
View all GnuPlot alternatives with detailed comparison →
Top Science & Engineering and Data Visualization and other similar apps like GnuPlot
Here are some alternatives to GnuPlot:
Suggest an alternative ❐OriginPro

MATLAB
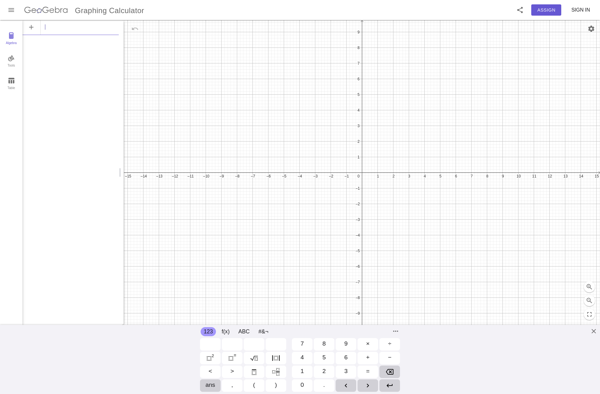
GeoGebra

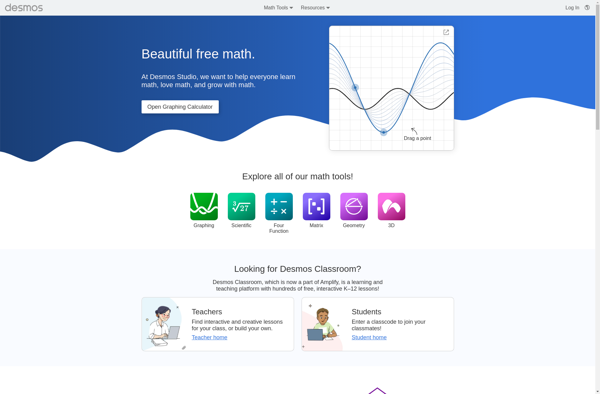
Desmos
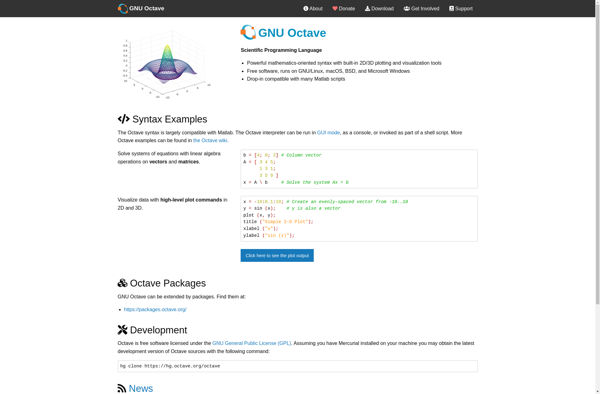
GNU Octave
NumeRe

SaiCalculator
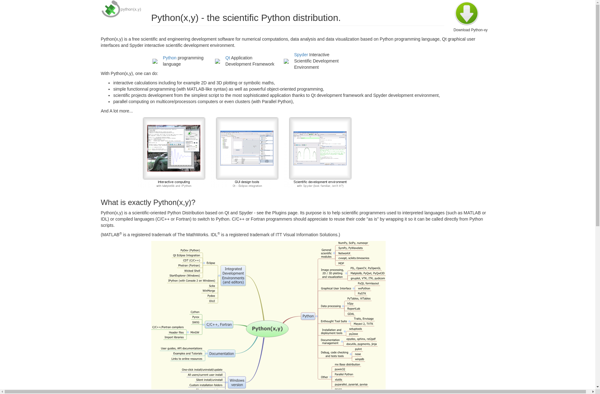
Python(x,y)
Graph Toy
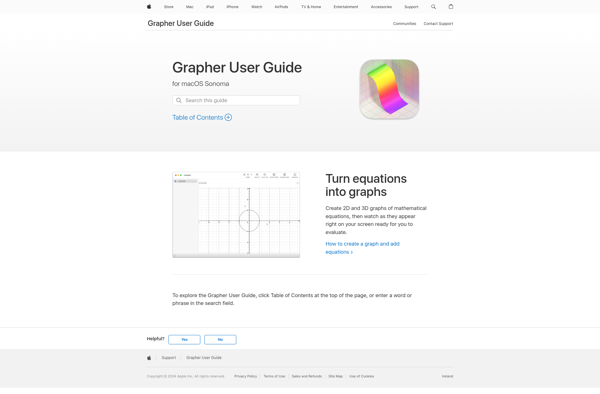
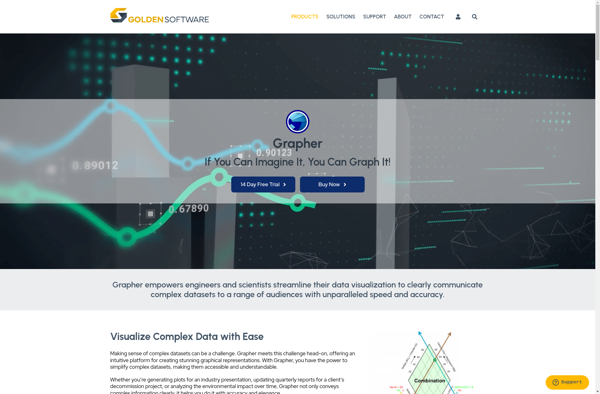
Grapher
Microsoft Mathematics
SciDaVis

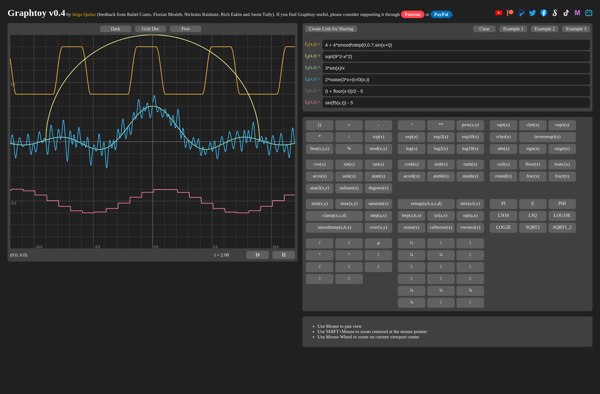
Graphtoy
Golden Software Grapher
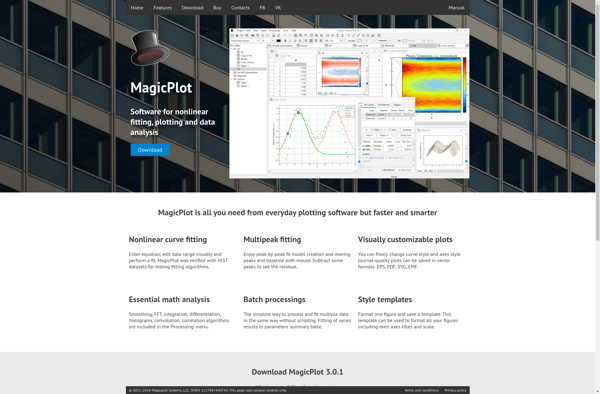
MagicPlot
GraphCalc
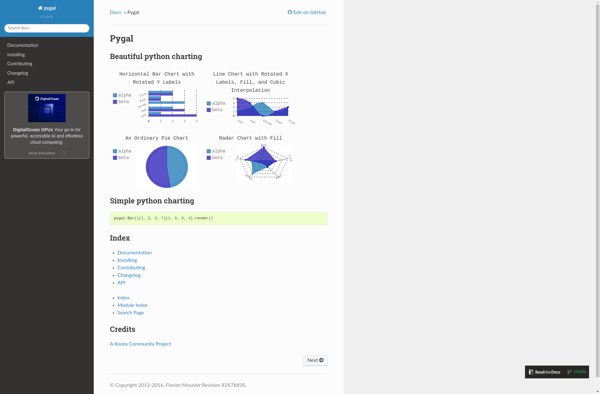
Pygal
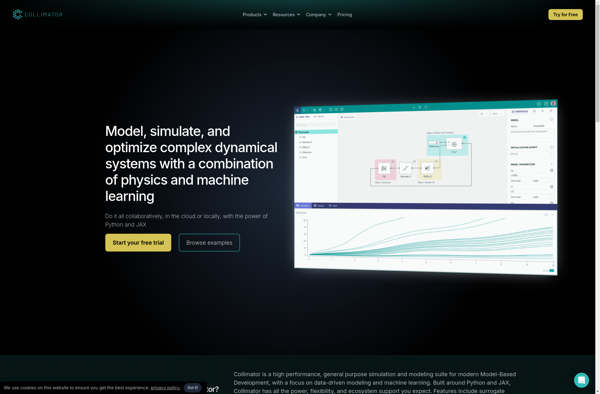
Collimator
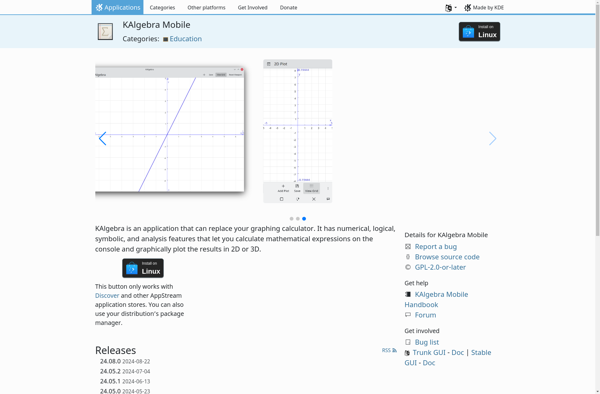
KAlgebra
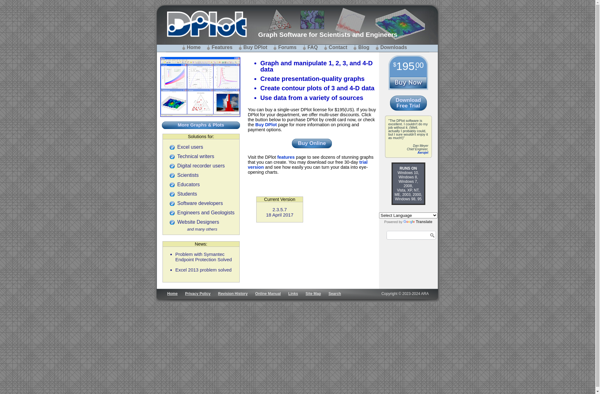
DPlot
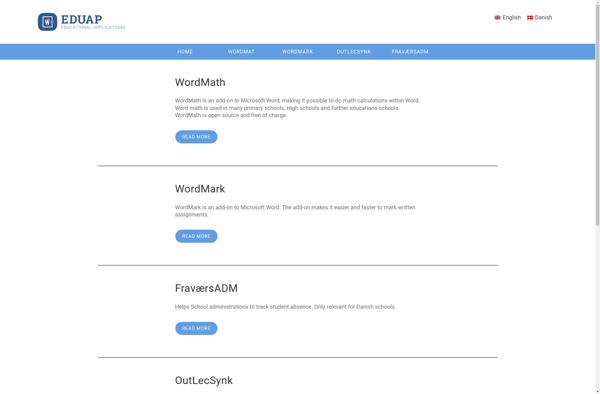
WordMat
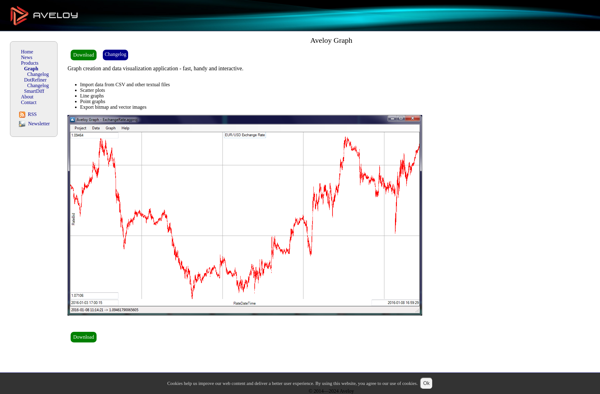
Aveloy Graph
Graphmatica

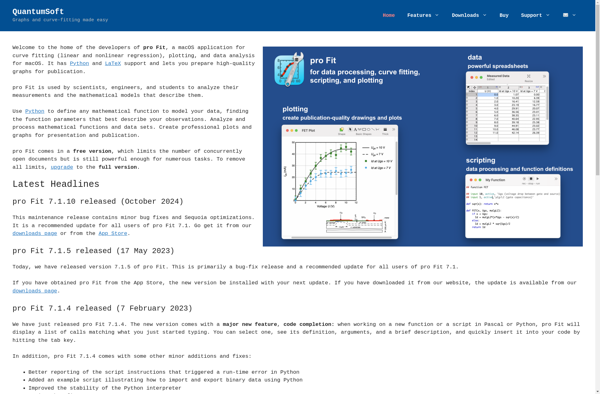
Pro Fit
KSEG

Matplotlib

JFreeChart
GeoGebra Graphing Calculator
Giac/Xcas

IGOR Pro

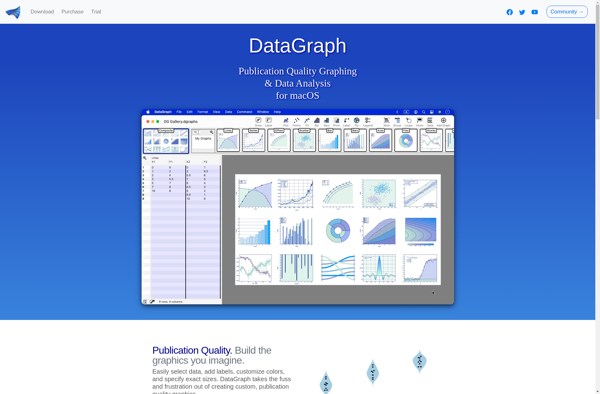
DataGraph
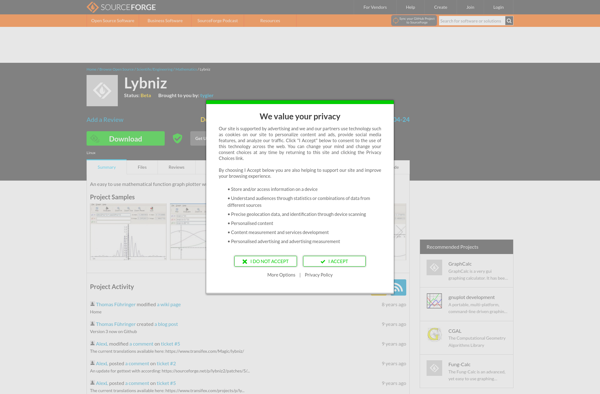
Lybniz
RGraph

Autograph

Dash Reports
LabPlot

GeoGebra CAS Calculator
GrafEq

Core Plot
MagicPlot Viewer

Timeplotters

Functy