NumeRe is an open-source numerical computing environment and programming language for numerical analysis, visualization, and statistics. It is similar to MATLAB and Python-based scientific computing packages, providing fast matrix operations, plotting tools, statistics functional
NumeRe is an open-source numerical computing environment and programming language for numerical analysis, visualization, and statistics. It is similar to MATLAB and Python-based scientific computing packages, providing fast matrix operations, plotting tools, statistics functionality, and interfaces to C/C++, Fortran, and Julia.
What is NumeRe?
NumeRe is an open-source platform for numerical computing, data analysis, and scientific visualization. It provides a MATLAB-like environment and programming language focused on matrix operations, linear algebra routines, statistical analysis, and plotting. Some key features of NumeRe include:
Fast vector/matrix math operations through integration of BLAS and LAPACK libraries
A high-level scripting language for writing programs to perform advanced numerical analysis
Built-in 2D and 3D plotting functions for data visualization
Statistics functionality like regression analysis, hypothesis testing, clustering, etc.
Interfaces to call external C, C++, Fortran, and Julia code libraries
Support for code parallelization through OpenMP
NumeRe is designed to offer similar capabilities to commercial solutions like MATLAB, while being completely free and open-source. It can be used across multiple platforms like Windows, Mac, and Linux for a wide range of numerical computing use cases in science, engineering, economics, and data science.
NumeRe Features
Features
Matrix operations
Plotting tools
Statistics functionality
Interfaces to C/C++, Fortran, and Julia
Pricing
Open Source
Pros
Open source
Fast matrix operations
Good for numerical analysis and statistics
Integrates with other languages like C/C++
Cons
Less comprehensive than MATLAB
Smaller user community than MATLAB or Python for scientific computing
Less support and documentation than proprietary options
R is an open-source programming language and free software environment for statistical computing, bioinformatics, graphics, data science, and general-purpose programming. The R language provides a wide variety of statistical analysis techniques and graphical capabilities which make it a popular choice for data analysis and visualization.Some key features of R include:Open-source...
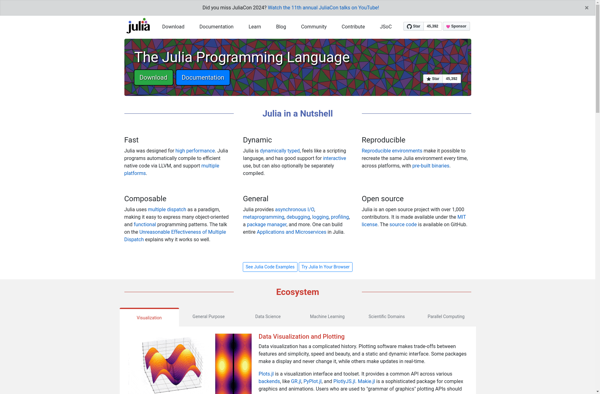
Julia is an open-source, high-level, dynamic programming language designed for scientific computing and data science. Some key aspects of Julia:High-performance JIT compiler that allows Julia to approach and often match the speeds of C and FortranDynamically typed, feels like a scripting language but with the speed of a compiled languageDesigned...
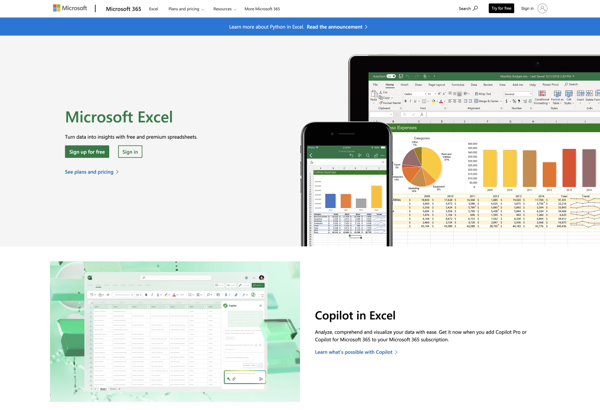
Microsoft Excel stands as the quintessential spreadsheet software, offering unparalleled versatility and functionality for individuals and businesses alike. A cornerstone of the Microsoft Office suite, Excel empowers users to organize, analyze, and interpret data efficiently. Its grid of cells allows for the creation of complex calculations, making it an indispensable...
LibreOffice Calc is the spreadsheet component of the LibreOffice suite, offering users a robust, open-source alternative for managing and analyzing data. As part of the free and open-source software movement, LibreOffice Calc provides a cost-effective and feature-rich solution for individuals, businesses, and organizations looking to break away from proprietary spreadsheet...
Minitab is a comprehensive software package used for statistical analysis and quality improvement applications. It has a wide range of analytical capabilities including basic statistics, regression analysis, design of experiments, statistical process control charts, reliability analysis, and more.Some key features and benefits of Minitab:User-friendly spreadsheet-style interface for entering, viewing, and...
Tableau is a leading business intelligence and data visualization platform used by organizations of all sizes to transform their data into easy-to-understand visualizations and dashboards. With Tableau, users can connect to a wide range of data sources, prepare and clean the data for analysis, and create interactive data visualizations such...
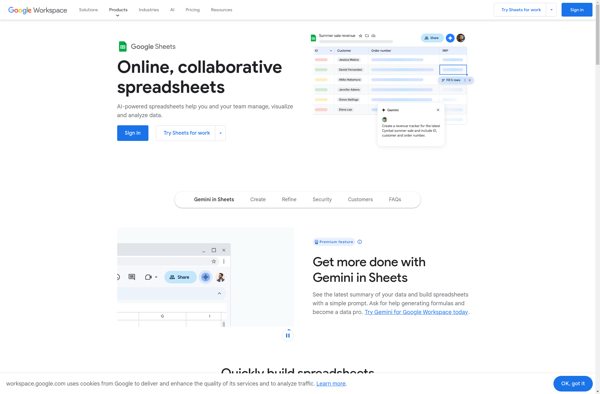
Google Sheets is a spreadsheet program developed by Google as part of its free, web-based Google Workspace productivity suite. It features the ability to create, view, edit and collaborate on spreadsheets online in real time. Key features of Google Sheets include:Create and edit spreadsheets with cells for different types of...
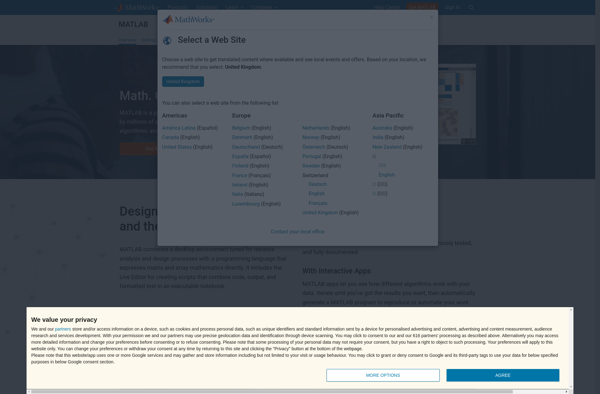
MATLAB (matrix laboratory) is a multi-paradigm numerical computing environment and proprietary programming language developed by MathWorks. MATLAB allows matrix manipulations, plotting of functions and data, implementation of algorithms, creation of user interfaces, and interfacing with programs written in other languages.Some key features of MATLAB include:Matrix and array-oriented language for faster...
GnuPlot is a powerful, stable and free scientific graphing package with advanced capabilities. Developed originally for Unix-like operating systems, GnuPlot is now available for Windows, macOS and Linux.It can produce high-quality graphical visualizations of data from files or stdin, including simple x-y plots, histograms, contour plots, mesh plots, polar plots,...
Scilab is an open source, cross-platform numerical computational package and a high level, numerically oriented programming language. It provides an interpreted programming language, linear algebra operations, numerical optimization, signal processing features, and the ability to plot functions and data.Originally created in 1990 by researchers from INRIA and ENPC in France,...
SigmaPlot is a comprehensive graphing and data analysis software designed for scientists and engineers across various industries. It enables users to easily visualize data, perform statistical analysis, and produce high-quality graphs and figures for publications, presentations, and reports.Key features of SigmaPlot include:Intuitive and customizable graphing interface to create 2D and...
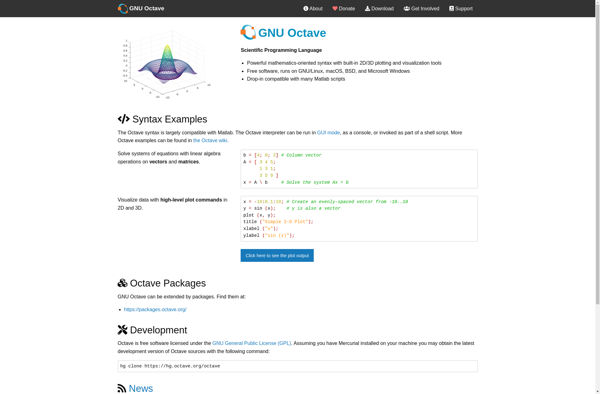
GNU Octave is an open-source mathematical programming language and environment that is compatible with MATLAB. It allows users to perform numerical computations, data manipulation and visualization, and other mathematical tasks. Some key features of GNU Octave include:An extensive library of mathematical functions for linear algebra, differential equations, optimization, statistics, and...
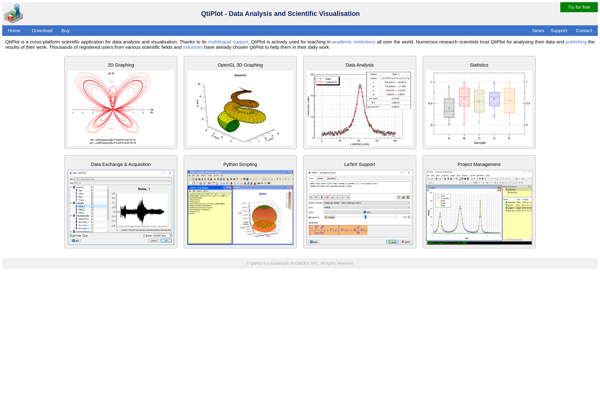
QtiPlot is an open-source data analysis and visualization application similar in scope and functionality to OriginLab's Origin software. Developed in C++ and utilizing the Qt framework, QtiPlot runs on Windows, MacOS, and Linux.QtiPlot provides a wide range of features for interactive scientific graphing and data analysis, including:2D and 3D plotting...
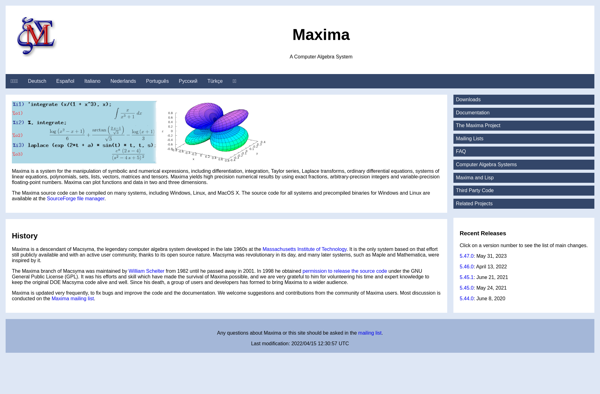
Maxima is a feature-rich open source computer algebra system that provides capabilities for symbolic computation and mathematical modeling. First released in 1968, Maxima descends from DOE Macsyma, one of the oldest such systems still in use and development today.Some of the key features and capabilities of Maxima include:Symbolic manipulation of...
Gnumeric is an free, open source spreadsheet program created to be a lightweight alternative to software like Microsoft Excel. It is designed to provide many of the common features found in Excel while using less system resources and without expensive licensing fees.Some key features of Gnumeric include:Support for a wide...
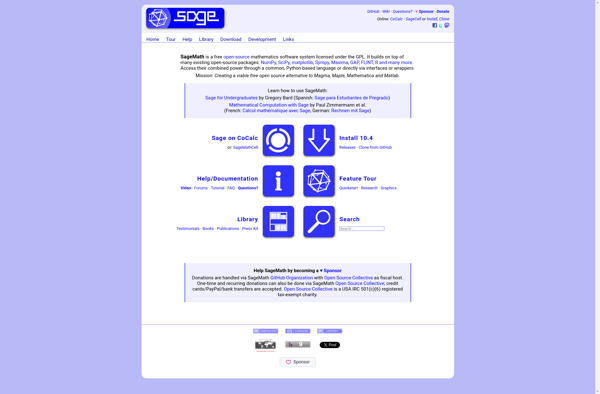
SageMath is an open-source mathematics software system that provides a viable free open source alternative to Magma, Maple, Mathematica and MATLAB. It is based on Python and implements a huge range of mathematics functionality including:Algebra - including commutative algebra, group theory, combinatorics, graph theory, exact linear algebra, and moreCalculus -...
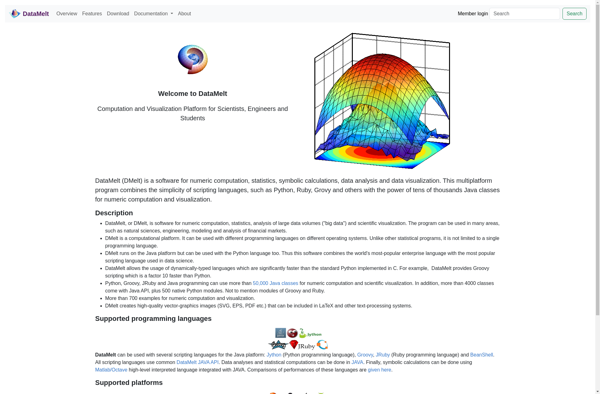
DataMelt is an open-source data analysis and visualization application aimed at scientists, engineers and students. It allows importing, cleaning, transforming, analyzing, visualizing and publishing scientific data with an intuitive graphical workflow editor interface.Some of its key features include:Import data from various sources like CSV, Excel, databases, APIs, etc.Clean, filter, merge,...
The data analysis tool is a powerful software for examining and making sense of all kinds of data. It provides a user-friendly graphical interface that allows anyone, from business analysts to data scientists, to easily visualize data, uncover patterns and trends, and generate valuable insights.Key features include:Interactive drag-and-drop interface for...
SciDaVis is a cross-platform computer program for numerical analysis and data visualization. It is designed to be compatible with OriginLab Origin software in terms of analysis capabilities and interface, while being free and open-source.Some key features of SciDaVis include:Interactive 2D and 3D plotting from imported dataA wide variety of 2D...
KaleidaGraph is a proprietary Windows-based 2D and 3D scientific data analysis and graphing software application specifically designed for scientists, engineers and technical enthusiasts who need to analyze and graph large volumes of data. First released in 1985 by Synergy Software, it has gone through continual development to the present version...
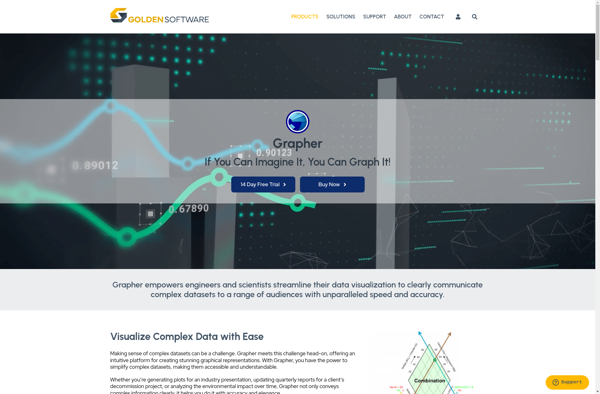
Golden Software Grapher is a powerful 2D and 3D scientific data visualization application. It enables users to create a wide variety of graphs and charts to represent complex data sets, including specialized plots like contour, vector, watershed, pie, bar, scatter, polar, ternary, statistical graphs and many more.Grapher excels at handling...
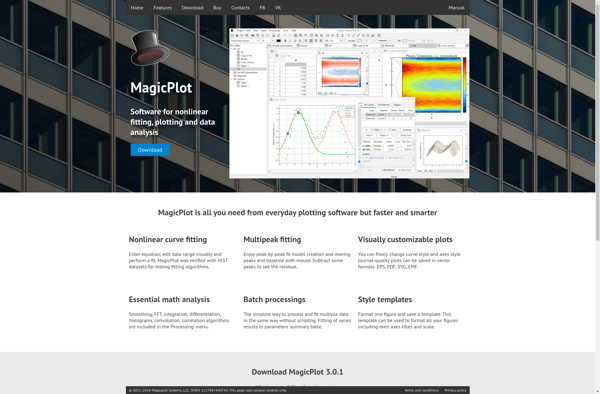
MagicPlot is a versatile software tool designed for scientific data analysis and publication-quality visualization. It runs on Windows, macOS, and Linux.With MagicPlot, users can import data from files or external sources, manipulate and analyze it, and create a wide variety of 2D and 3D graphs and charts. Its key features...
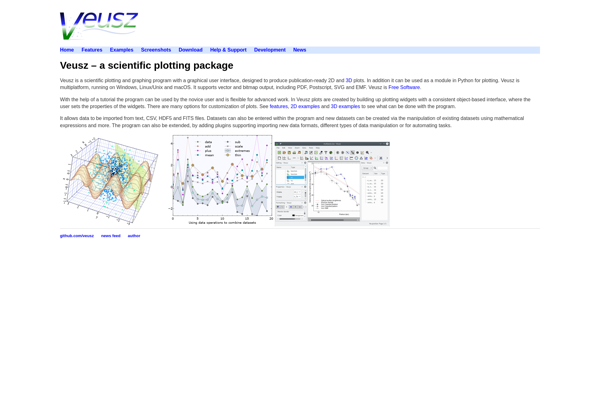
Veusz is an open-source application designed for interactive plotting and graphing of scientific data. It can generate a wide variety of 2D and 3D plots including line plots, scatter plots, histograms, contour plots, vector fields, bar charts, maps and more.Some key features of Veusz include:Intuitive graphical user interface for interactive...
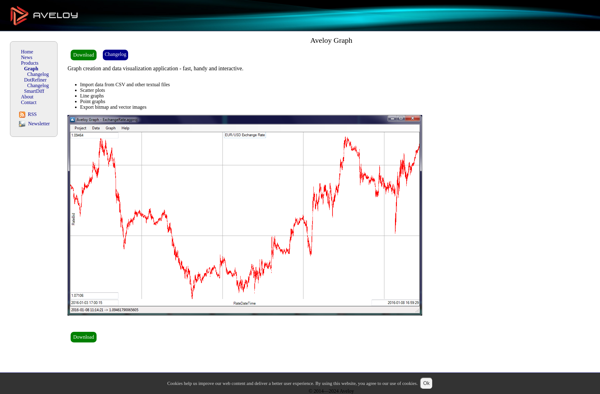
Aveloy Graph is a no-code business intelligence analytics and visualization software for building interactive dashboards. It provides an intuitive way for users of all skill levels to visualize data and create shareable analytics.With Aveloy Graph, users can connect data from multiple sources including MySQL, PostgreSQL, MongoDB, Excel, CSV files, and...
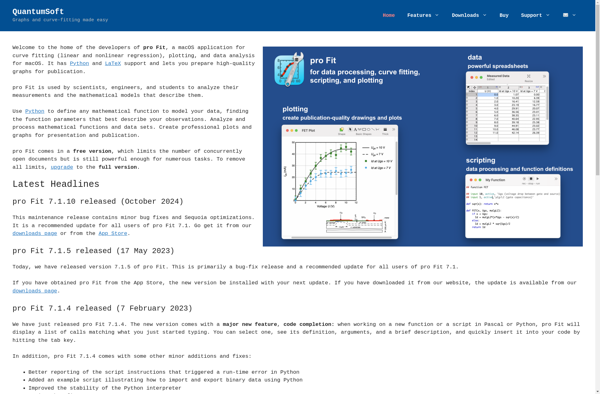
pro Fit is a popular workout and fitness tracking mobile app available for iOS and Android. It allows users to log various types of exercises including strength training, cardio, yoga, pilates, and more. Key features of pro Fit include:Exercise database with 1300+ exercises covering all major muscle groupsCustomizable fitness routines...
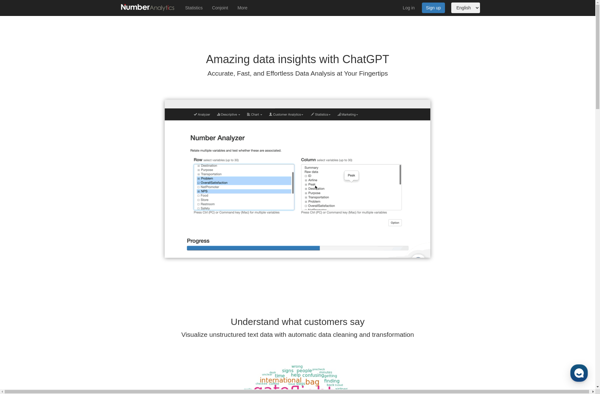
Number Analytics is a powerful data analytics and business intelligence platform designed specifically for working with numerical and quantitative data. It provides a wide range of features and capabilities for data preparation, statistical analysis, data visualization, and reporting.Some of the key capabilities of Number Analytics include:Data connectivity to import data...
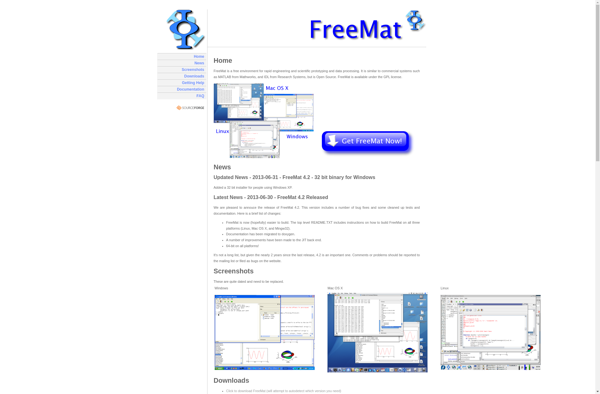
Freemat is an open-source numerical computing environment that is very similar to MATLAB. It provides many of the same capabilities as MATLAB including:A high-level interactive language for numerical computations2D and 3D plotting and visualization toolsBuilt-in mathematical and statistical functionsSupport for linear algebra, signal processing, optimization, and moreSome key advantages of...
Matplotlib is a comprehensive 2D plotting library for Python that enables users to create a wide variety of publication-quality graphs, charts, and visualizations. It supports many basic and advanced plotting functionalities and integrates well with NumPy and Pandas data structures.Matplotlib can be used to visualize data in a variety of...
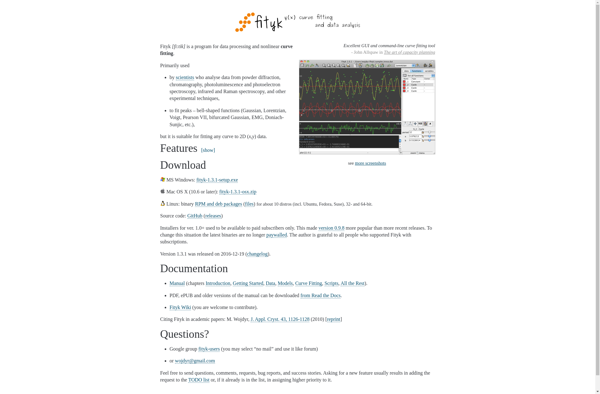
Fityk is a powerful and versatile open-source software for nonlinear curve fitting and data analysis. It offers a graphical user interface along with a command line interface and Python bindings. Some key features of Fityk include:Supports a wide range of analytical fitting functions including peaks, baselines, custom models defined by...
IGOR Pro is a powerful data analysis and visualization software application developed by WaveMetrics. It uses an object-oriented approach, allowing users to analyze and process data interactively through a drag-and-drop workflow interface.Some key features of IGOR Pro include:Interactive 2D and 3D scientific graphing and publication-quality plottingA wide range of analysis...
Lybniz is a free, open-source graphing calculator software for Windows, Linux and macOS operating systems. It provides an intuitive graphical user interface for drawing mathematical equations, functions and graphs on screen. As equations are typed or drawn with the mouse, Lybniz dynamically plots the corresponding graph, allowing for visualization and...
LabPlot is a free, open source and cross-platform data visualization and analysis software aimed primarily at the education sector. It allows users to create 2D and 3D plots, analyze data statistically, fit functions to data points, manipulate data sets and organize them in a spreadsheet-like interface.Some of the key features...
Grapheme is an open-source web application for creating and editing fonts. It provides a vector graphics editor optimized for designing letterforms and other glyphs. Grapheme simplifies the font creation workflow by handling curve normalization, glyph naming, and font generation.Key features of Grapheme include:Intuitive pen and node editing tools for drawing...
Core Plot is an open-source, 2D plotting framework for macOS, iOS, and tvOS applications. It enables developers to easily create high-performance, publication-quality graphs and charts for inclusion in native Mac, iPhone, iPad, and Apple TV apps.Some key capabilities and benefits of Core Plot include:High-performance rendering, with full support for large...