KaleidaGraph
KaleidaGraph: Scientific Data Analysis
Proprietary 2D and 3D graphing software for scientists, engineers and technical enthusiasts, enabling large data analysis and high-quality graphics.
What is KaleidaGraph?
KaleidaGraph is a proprietary Windows-based 2D and 3D scientific data analysis and graphing software application specifically designed for scientists, engineers and technical enthusiasts who need to analyze and graph large volumes of data. First released in 1985 by Synergy Software, it has gone through continual development to the present version 4.5.
Key features include flexible curve fitting and model building tools, high-quality 2D and 3D graphics capabilities for publications and presentations, data processing and analysis of large data volumes, and comprehensive support for applying error bars. It also includes a scripting language for automation and customization.
Designed as an easy-to-use alternative to programming languages like R and MATLAB for non-programmers, KaleidaGraph enables scientists to visualize and understand patterns in data, test hypotheses, validate models with statistical analysis tools, identify trends, and present results with publication-quality graphs. Its workflow retains the link between raw data, analysis and graphic results.
KaleidaGraph has a loyal user base in various fields including physics, chemistry, biology, pharmacology, engineering and more. It works well for individuals and small workgroups. Larger deployments are better served by data analysis platforms like MATLAB or Mathematica.
Pricing starts at $270 for an individual license with volume and academic discounts available. Free trial available from the Synergy Software website.
KaleidaGraph Features
Features
- Data analysis
- Curve fitting
- Model building
- 2D and 3D graphing
- Large data handling
- High-quality graphics
- Customizable interface
- Macro programming
- Add-ons for specialty graphs
Pricing
- One-time Purchase
Pros
Cons
Official Links
Reviews & Ratings
Login to ReviewThe Best KaleidaGraph Alternatives
Top Science & Engineering and Data Analysis and other similar apps like KaleidaGraph
Here are some alternatives to KaleidaGraph:
Suggest an alternative ❐LibreOffice - Calc
Numbers
NumeRe

Simple Spreadsheet
Gnumeric

GraphSketcher
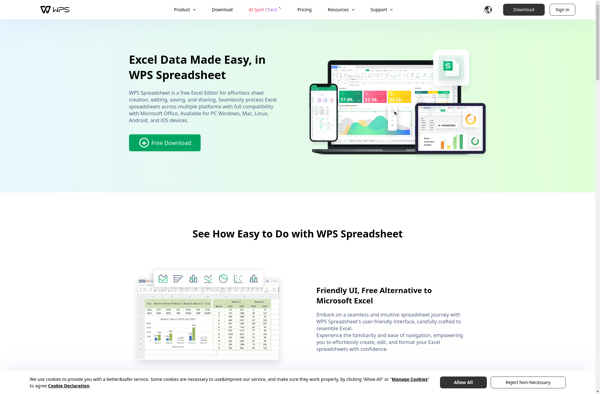
WPS Spreadsheet
IGOR Pro

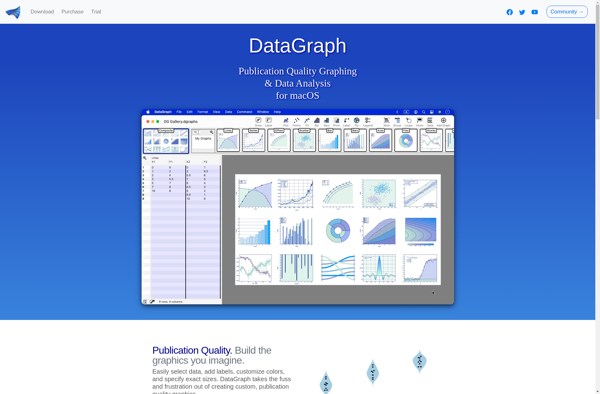
DataGraph
Spreadsheet Conversion Tool

Apache OpenOffice Calc
