GraphSketcher
GraphSketcher: Free Open-Source Graph Drawing Software
GraphSketcher is a free, open-source software for drawing different types of graphs and diagrams. It allows users to easily create flow charts, UML diagrams, ER diagrams, network diagrams, mockups, floor plans, and more. Key features include a simple and intuitive interface, auto layout and formatting tools, export to various file types such as PNG, SVG, PDF, etc.
What is GraphSketcher?
GraphSketcher is a powerful yet easy-to-use diagramming and graphing software. As an open-source application, GraphSketcher is completely free to download and use. It runs on Windows, Mac, and Linux operating systems.
With an intuitive drag-and-drop interface, GraphSketcher makes it simple for users to create a wide range of diagrams and charts. These include flowcharts, UML diagrams, ER diagrams, network diagrams, mockups, floorplans, and more. There are various inbuilt templates and samples to help users get started quickly.
GraphSketcher provides advanced automatic layout and formatting features. Complex diagrams with hundreds of elements can be auto-arranged with a single click. It also enables editing the aesthetics of diagrams by changing themes, applying styles, and more.
Users can export their diagrams in PNG, JPEG, SVG, PDF formats and as HTML image map. The files can then be included in documentation, presentations, websites, and more.
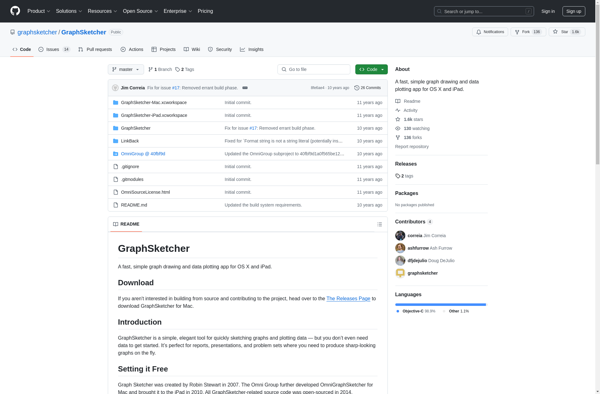
An active community of developers maintains and updates GraphSketcher. Users can easily report bugs, request features, and contribute to the project on GitHub. The software is available for free download from the official website.
In summary, GraphSketcher is an ideal free alternative for commercial tools like Microsoft Visio. It makes diagramming accessible for everyone across devices and platforms.
GraphSketcher Features
Features
- Simple and intuitive interface
- Auto layout and formatting tools
- Create flow charts, UML diagrams, ER diagrams, network diagrams, mockups, floor plans
- Export to PNG, SVG, PDF file types
Pricing
- Free
- Open Source
Pros
Cons
Reviews & Ratings
Login to ReviewThe Best GraphSketcher Alternatives
View all GraphSketcher alternatives with detailed comparison →
Top Office & Productivity and Diagramming and other similar apps like GraphSketcher
Here are some alternatives to GraphSketcher:
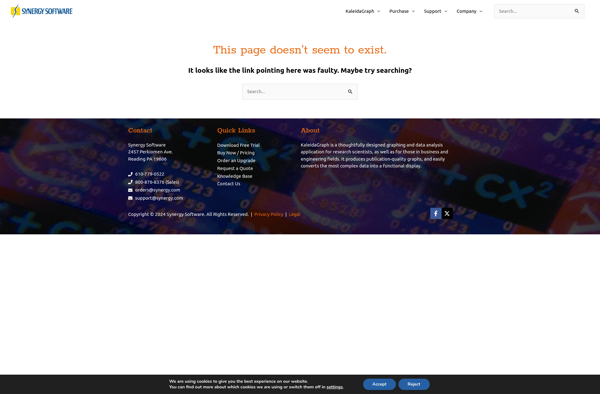
Suggest an alternative ❐KaleidaGraph
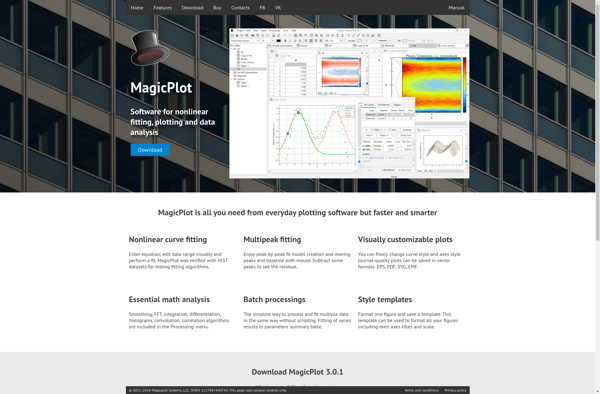
MagicPlot
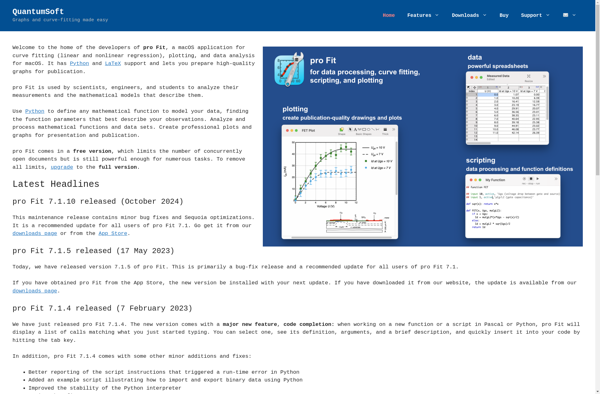
Pro Fit
Lybniz
GeoGebra CAS Calculator
Core Plot