Core Plot is an open-source 2D plotting framework for macOS, iOS, and tvOS. It provides high-performance plotting, numerical analysis, and data visualization functionality to developers writing native Mac, iPhone, iPad, and Apple TV apps.
Core Plot: Open-Source 2D Plotting Framework for macOS, iOS, tvOSs
High-performance plotting, numerical analysis, and data visualization functionality for native Mac, iPhone, iPad, and Apple TV apps.
What is Core Plot?
Core Plot is an open-source, 2D plotting framework for macOS, iOS, and tvOS applications. It enables developers to easily create high-performance, publication-quality graphs and charts for inclusion in native Mac, iPhone, iPad, and Apple TV apps.
Some key capabilities and benefits of Core Plot include:
High-performance rendering, with full support for large and dynamically updating data sets
Extensive customization options for controlling visual styles and layouts
Support for bar graphs, scatter plots, area graphs, pie charts, and more
Tools for performing numerical analysis, curve fitting, and statistical analysis
Ability to export graph images
Compatible with Swift and Objective-C
Liberal MIT open-source license allowing modification and integration into proprietary apps
With its focus on speed, flexibility, and ease-of-use, Core Plot saves developers time and effort when building scientific, financial, statistical, and other data visualization functionality into their apps. Its open-source nature also makes Core Plot easily customizable and extensible to meet specialized or advanced plotting needs.
Core Plot Features
Features
High performance 2D plotting
Support for bar, line, scatter, pie, area and other plot types
Date plotting with customizable axes
Legend support
Customizable styles and themes
Zooming, panning, and scrolling
Export plots as images
Bind plots to Core Data and load data asynchronously
Mac, iOS, tvOS support
Pricing
Open Source
Pros
Fast and optimized for mobile
Lightweight and easy to integrate
Good documentation
Active development and support
Very customizable and extensible
Open source and free
Cons
Limited built-in support for 3D plotting
Steep learning curve
Requires knowledge of Core Animation and Quartz
Lacks some advanced statistical/analytics features
OriginPro is a powerful data analysis and graphing software designed for scientists, engineers, and analysts across various industries. It is developed by OriginLab Corporation for analyzing, graphing, and presenting scientific data.Some of the key features of OriginPro include:An extensive selection of analysis tools like peak analysis, surface fitting, statistics, signal...
GeoGebra is a free, open-source dynamic mathematics software that can be used for teaching and learning mathematics at all levels of education. It combines geometry, algebra, spreadsheets, graphing, statistics and calculus in one easy-to-use and well-integrated package making it an excellent tool for demonstrating mathematical concepts.Some of the key features...
GnuPlot is a powerful, stable and free scientific graphing package with advanced capabilities. Developed originally for Unix-like operating systems, GnuPlot is now available for Windows, macOS and Linux.It can produce high-quality graphical visualizations of data from files or stdin, including simple x-y plots, histograms, contour plots, mesh plots, polar plots,...
NumeRe is an open-source platform for numerical computing, data analysis, and scientific visualization. It provides a MATLAB-like environment and programming language focused on matrix operations, linear algebra routines, statistical analysis, and plotting. Some key features of NumeRe include:Fast vector/matrix math operations through integration of BLAS and LAPACK librariesA high-level scripting...
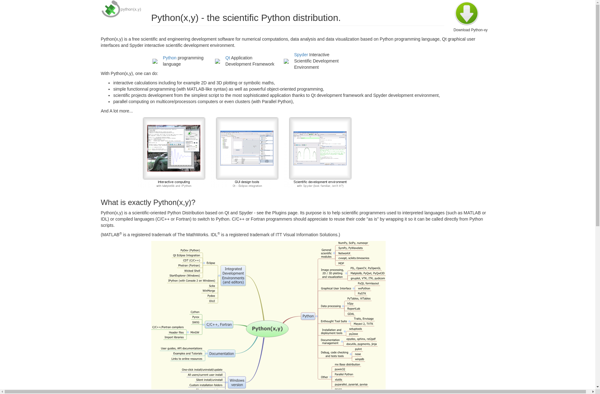
python(x,y) is an open-source mathematical plotting and data visualization library for the Python programming language. It is designed to be simple, efficient, and highly customizable. python(x,y) provides a MATLAB-like interface for creating a wide range of 2D plots, including line plots, scatter plots, histograms, bar charts, pie charts, error bars,...
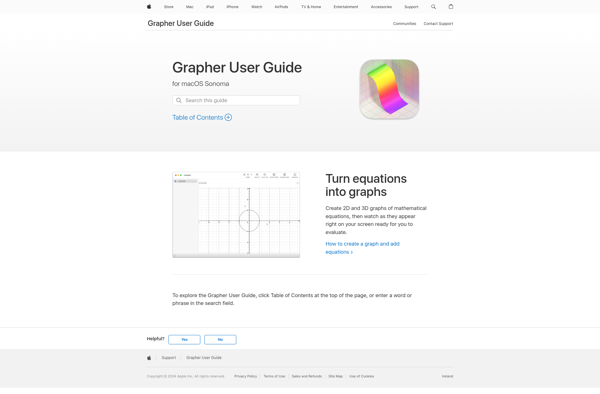
Grapher is a powerful 2D and 3D graphing utility developed by Apple Inc. and included with macOS. It allows users to visualize a wide variety of data sets, equations, geometric shapes, scalar/vector fields in 2D and 3D, and more. Some key features of Grapher include:Intuitive interface for entering equations and...
SciDaVis is a cross-platform computer program for numerical analysis and data visualization. It is designed to be compatible with OriginLab Origin software in terms of analysis capabilities and interface, while being free and open-source.Some key features of SciDaVis include:Interactive 2D and 3D plotting from imported dataA wide variety of 2D...
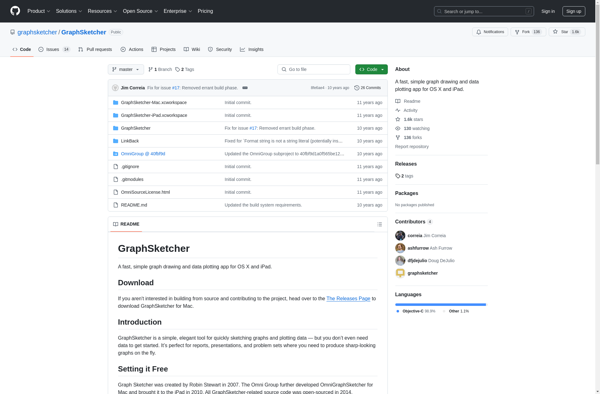
GraphSketcher is a powerful yet easy-to-use diagramming and graphing software. As an open-source application, GraphSketcher is completely free to download and use. It runs on Windows, Mac, and Linux operating systems.With an intuitive drag-and-drop interface, GraphSketcher makes it simple for users to create a wide range of diagrams and charts....
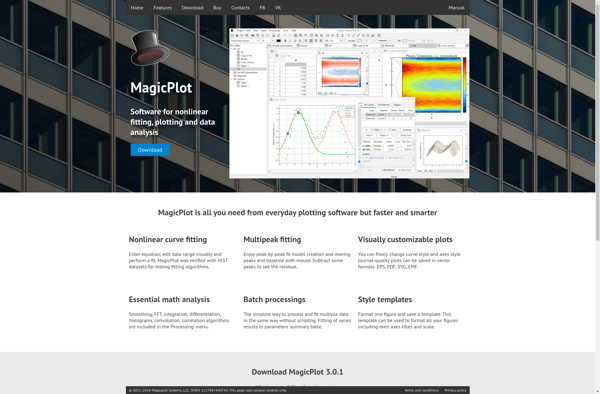
MagicPlot is a versatile software tool designed for scientific data analysis and publication-quality visualization. It runs on Windows, macOS, and Linux.With MagicPlot, users can import data from files or external sources, manipulate and analyze it, and create a wide variety of 2D and 3D graphs and charts. Its key features...
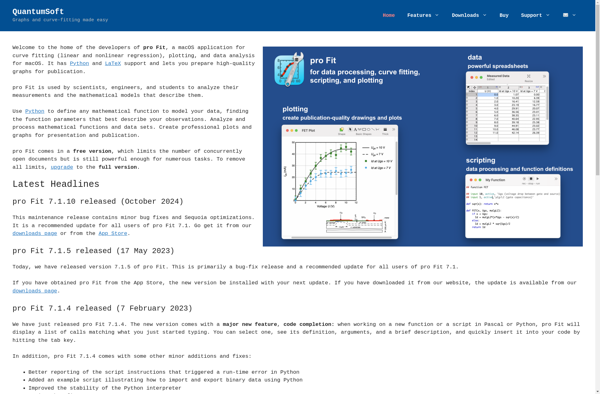
pro Fit is a popular workout and fitness tracking mobile app available for iOS and Android. It allows users to log various types of exercises including strength training, cardio, yoga, pilates, and more. Key features of pro Fit include:Exercise database with 1300+ exercises covering all major muscle groupsCustomizable fitness routines...
Matplotlib is a comprehensive 2D plotting library for Python that enables users to create a wide variety of publication-quality graphs, charts, and visualizations. It supports many basic and advanced plotting functionalities and integrates well with NumPy and Pandas data structures.Matplotlib can be used to visualize data in a variety of...
GrafEq is an open-source, cross-platform math equation editor and graphing calculator software. It is designed to help students, teachers, scientists, and engineers visualize and analyze mathematical functions and data.Key features of GrafEq include:Intuitive equation editor for writing math expressions with standard LaTeX math syntax2D and 3D function graphing with control...
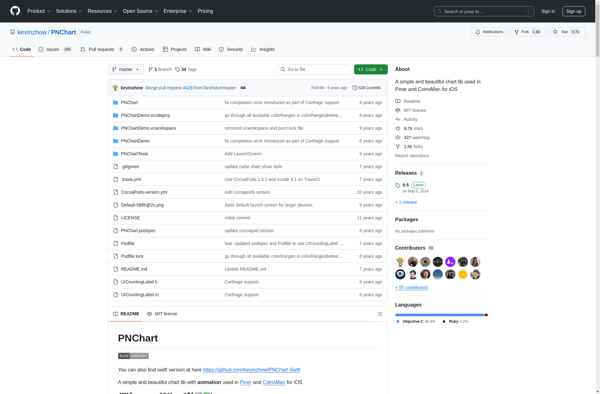
PNChart is an open-source charting library for iOS applications. It allows developers to easily create animated and interactive charts such as pie charts, bar charts, line charts and more without needing to spend time on the complex math and algorithms behind chart creation.Some key features of PNChart include:Support for pie,...
Timeplotters is a time tracking and productivity software designed to help users visualize how they spend their time. It has an intuitive interface that makes time tracking easy and even fun.Key features of Timeplotters include:Easy and automatic time tracking with the ability to track time down to the second.Colorful interactive...