Core Plot
Description: Core Plot is an open-source 2D plotting framework for macOS, iOS, and tvOS. It provides high-performance plotting, numerical analysis, and data visualization functionality to developers writing native Mac, iPhone, iPad, and Apple TV apps.
Type: software
Pricing: Open Source
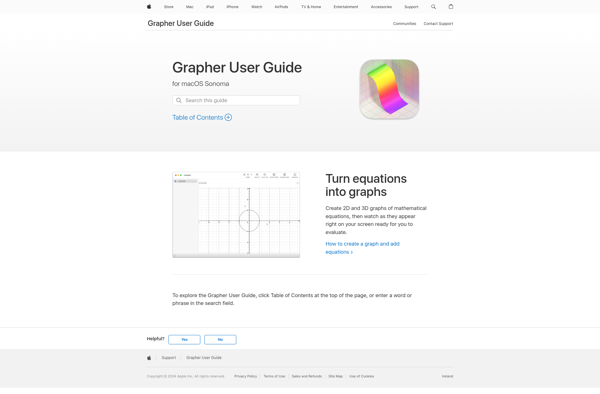
Grapher
Description: Grapher is a 2D and 3D graphing utility for macOS that allows users to visualize data sets, equations, geometric shapes, and more. It includes features for customizing graph appearance, adding text annotations, animations, exporting images, and mathematical calculations.
Type: software