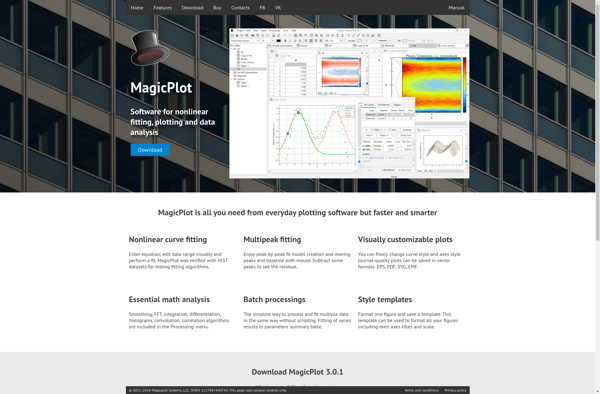
MagicPlot is a cross-platform software used for scientific visualization and data analysis. It allows users to generate 2D and 3D plots from data, fit curves, perform statistical analysis, and customize graphs. MagicPlot is noted for its user-friendly interface and publication-qu
MagicPlot: Cross-platform software for scientific visualization and data analysis
MagicPlot allows users to generate 2D and 3D plots from data, fit curves, perform statistical analysis, and customize graphs, offering a user-friendly interface and publication-quality output.
What is MagicPlot?
MagicPlot is a versatile software tool designed for scientific data analysis and publication-quality visualization. It runs on Windows, macOS, and Linux.
With MagicPlot, users can import data from files or external sources, manipulate and analyze it, and create a wide variety of 2D and 3D graphs and charts. Its key features include:
Intuitive and customizable interface
Advanced data analysis tools like statistics, curve fitting, surface fitting, etc.
Support for various 2D, 3D and 4D plot types like line, scatter, bar, pie, surface, contour, vector fields, histograms, and many more
Tools for mathematical calculations and data processing
Image and document export in PNG, JPEG, PDF, PS, EPS, SVG formats
LaTeX integration for publication-ready output
Graph customization with themes, styles, annotation, legends, etc.
Scripting and automation capability
With its flexible features and ease of use, MagicPlot is a recommended alternative scientific graphing and data analysis software for researchers, engineers, businesses, and students.
MagicPlot Features
Features
2D and 3D plotting
Curve fitting
Statistical analysis
Customizable graphs
User-friendly interface
High-quality output
Pricing
Free limited version
One-time purchase
Subscription-based
Pros
Intuitive and easy to use
Powerful data analysis capabilities
High-quality graphics
Cross-platform compatibility
Customizable and extensible via plugins
Affordable pricing
Cons
Limited built-in statistical functions compared to dedicated stats software
Less flexibility than programming-based data visualization tools
Only available as desktop application, no web or mobile versions
OriginPro is a powerful data analysis and graphing software designed for scientists, engineers, and analysts across various industries. It is developed by OriginLab Corporation for analyzing, graphing, and presenting scientific data.Some of the key features of OriginPro include:An extensive selection of analysis tools like peak analysis, surface fitting, statistics, signal...
GnuPlot is a powerful, stable and free scientific graphing package with advanced capabilities. Developed originally for Unix-like operating systems, GnuPlot is now available for Windows, macOS and Linux.It can produce high-quality graphical visualizations of data from files or stdin, including simple x-y plots, histograms, contour plots, mesh plots, polar plots,...
NumeRe is an open-source platform for numerical computing, data analysis, and scientific visualization. It provides a MATLAB-like environment and programming language focused on matrix operations, linear algebra routines, statistical analysis, and plotting. Some key features of NumeRe include:Fast vector/matrix math operations through integration of BLAS and LAPACK librariesA high-level scripting...
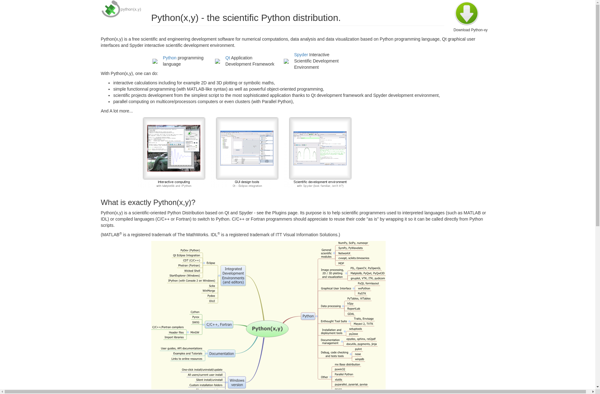
python(x,y) is an open-source mathematical plotting and data visualization library for the Python programming language. It is designed to be simple, efficient, and highly customizable. python(x,y) provides a MATLAB-like interface for creating a wide range of 2D plots, including line plots, scatter plots, histograms, bar charts, pie charts, error bars,...
SciDaVis is a cross-platform computer program for numerical analysis and data visualization. It is designed to be compatible with OriginLab Origin software in terms of analysis capabilities and interface, while being free and open-source.Some key features of SciDaVis include:Interactive 2D and 3D plotting from imported dataA wide variety of 2D...
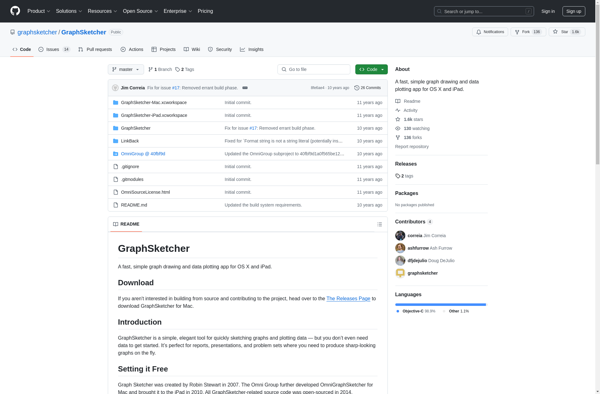
GraphSketcher is a powerful yet easy-to-use diagramming and graphing software. As an open-source application, GraphSketcher is completely free to download and use. It runs on Windows, Mac, and Linux operating systems.With an intuitive drag-and-drop interface, GraphSketcher makes it simple for users to create a wide range of diagrams and charts....
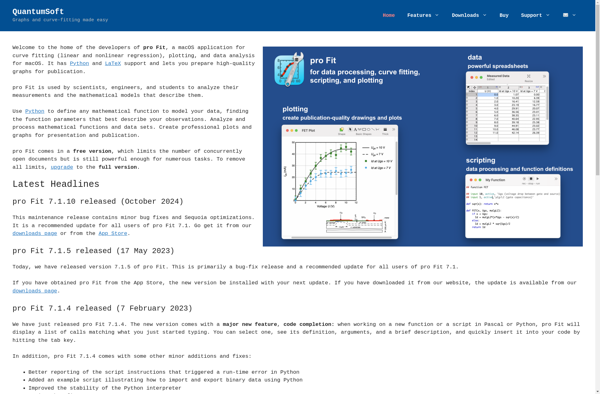
pro Fit is a popular workout and fitness tracking mobile app available for iOS and Android. It allows users to log various types of exercises including strength training, cardio, yoga, pilates, and more. Key features of pro Fit include:Exercise database with 1300+ exercises covering all major muscle groupsCustomizable fitness routines...
Matplotlib is a comprehensive 2D plotting library for Python that enables users to create a wide variety of publication-quality graphs, charts, and visualizations. It supports many basic and advanced plotting functionalities and integrates well with NumPy and Pandas data structures.Matplotlib can be used to visualize data in a variety of...
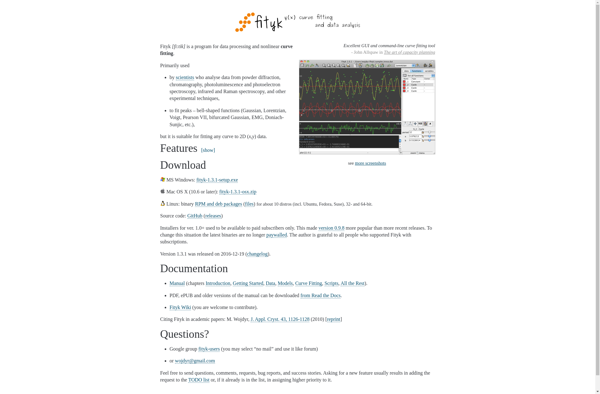
Fityk is a powerful and versatile open-source software for nonlinear curve fitting and data analysis. It offers a graphical user interface along with a command line interface and Python bindings. Some key features of Fityk include:Supports a wide range of analytical fitting functions including peaks, baselines, custom models defined by...
IGOR Pro is a powerful data analysis and visualization software application developed by WaveMetrics. It uses an object-oriented approach, allowing users to analyze and process data interactively through a drag-and-drop workflow interface.Some key features of IGOR Pro include:Interactive 2D and 3D scientific graphing and publication-quality plottingA wide range of analysis...
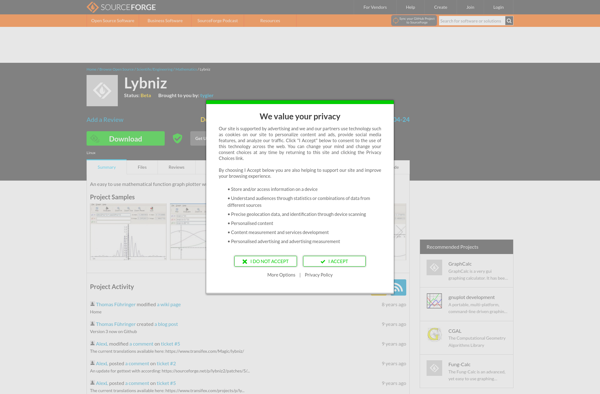
Lybniz is a free, open-source graphing calculator software for Windows, Linux and macOS operating systems. It provides an intuitive graphical user interface for drawing mathematical equations, functions and graphs on screen. As equations are typed or drawn with the mouse, Lybniz dynamically plots the corresponding graph, allowing for visualization and...
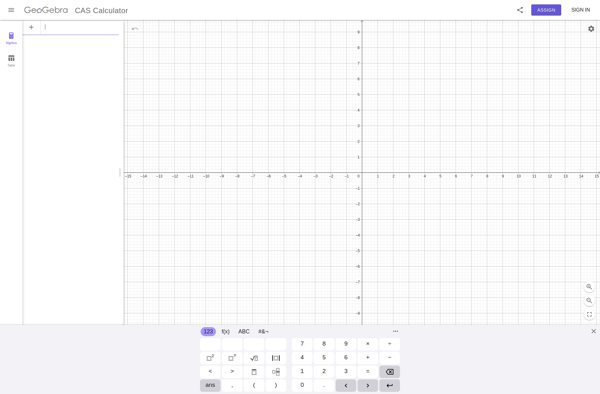
GeoGebra is a free, multi-platform dynamic mathematics software that joins geometry, algebra, tables, graphing, statistics and calculus in one easy-to-use package. It can be used for all levels of mathematics education from elementary through university level. Some of the key features of GeoGebra include:Graphing functions, inequalities, conic sectionsDynamic geometric constructions,...
Core Plot is an open-source, 2D plotting framework for macOS, iOS, and tvOS applications. It enables developers to easily create high-performance, publication-quality graphs and charts for inclusion in native Mac, iPhone, iPad, and Apple TV apps.Some key capabilities and benefits of Core Plot include:High-performance rendering, with full support for large...
MagicPlot Viewer is a free standalone application developed by MagicPlot Inc. to view MagicPlot project files (.mpprj) without needing a full MagicPlot license. It provides core visualization and analysis capabilities to open existing plots, charts, equations and fitted data created with the MagicPlot software.Key features of MagicPlot Viewer include:Opens MagicPlot...