MagicPlot Viewer is a free software used to view MagicPlot project files. It allows opening mpprj files to visualize 2D and 3D plots, charts, equations and fit data without requiring a MagicPlot license.
A free software tool for viewing MagicPlot project files, allowing users to open mpprj files to visualize 2D and 3D plots, charts, equations, and fit data without needing a MagicPlot license.
What is MagicPlot Viewer?
MagicPlot Viewer is a free standalone application developed by MagicPlot Inc. to view MagicPlot project files (.mpprj) without needing a full MagicPlot license. It provides core visualization and analysis capabilities to open existing plots, charts, equations and fitted data created with the MagicPlot software.
Key features of MagicPlot Viewer include:
Opens MagicPlot project files to access existing graphs, charts, surfaces and analysis results
Supports 2D and 3D plotting with zooming, rotation and export capabilities
Displays legends, axes, grids, labels and other plot formatting
Shows analysis information like fitted equations, error values, residuals plots etc.
Available for Windows, Mac and Linux operating systems
Lightweight app taking up minimal storage space
Ideal for sharing visualizations without needing access to MagicPlot software
As it is focused on project viewing rather than editing or creating new plots, the MagicPlot Viewer lacks data import options, scripting tools or ability to modify graphs. But it provides an easy way to visualize MagicPlot files for free without any licensing requirements.
OriginPro is a powerful data analysis and graphing software designed for scientists, engineers, and analysts across various industries. It is developed by OriginLab Corporation for analyzing, graphing, and presenting scientific data.Some of the key features of OriginPro include:An extensive selection of analysis tools like peak analysis, surface fitting, statistics, signal...
GnuPlot is a powerful, stable and free scientific graphing package with advanced capabilities. Developed originally for Unix-like operating systems, GnuPlot is now available for Windows, macOS and Linux.It can produce high-quality graphical visualizations of data from files or stdin, including simple x-y plots, histograms, contour plots, mesh plots, polar plots,...
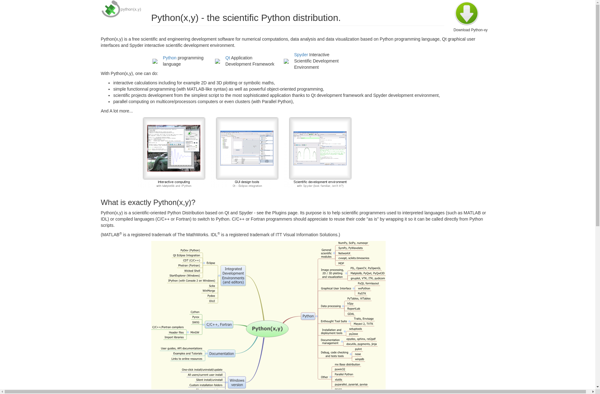
python(x,y) is an open-source mathematical plotting and data visualization library for the Python programming language. It is designed to be simple, efficient, and highly customizable. python(x,y) provides a MATLAB-like interface for creating a wide range of 2D plots, including line plots, scatter plots, histograms, bar charts, pie charts, error bars,...
SciDaVis is a cross-platform computer program for numerical analysis and data visualization. It is designed to be compatible with OriginLab Origin software in terms of analysis capabilities and interface, while being free and open-source.Some key features of SciDaVis include:Interactive 2D and 3D plotting from imported dataA wide variety of 2D...
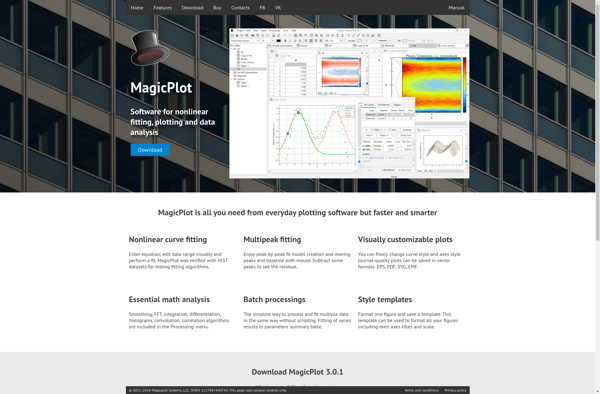
MagicPlot is a versatile software tool designed for scientific data analysis and publication-quality visualization. It runs on Windows, macOS, and Linux.With MagicPlot, users can import data from files or external sources, manipulate and analyze it, and create a wide variety of 2D and 3D graphs and charts. Its key features...
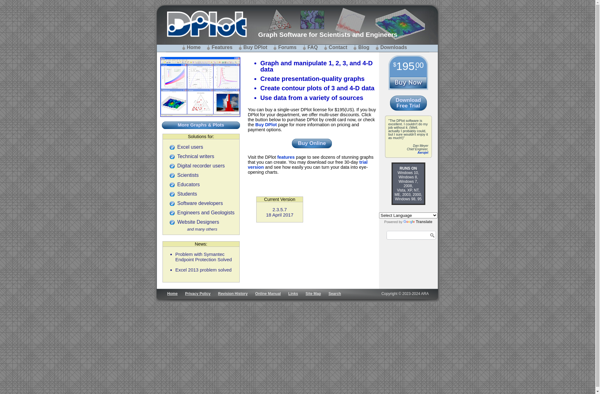
DPlot is an open-source, cross-platform application designed for interactive scientific data visualization and analysis. It features a user-friendly graphical interface that allows users to easily create 2D and 3D plots, fit data to both linear and non-linear models, perform statistical analysis, and customize graph attributes.Some key features of DPlot include:Support...
Matplotlib is a comprehensive 2D plotting library for Python that enables users to create a wide variety of publication-quality graphs, charts, and visualizations. It supports many basic and advanced plotting functionalities and integrates well with NumPy and Pandas data structures.Matplotlib can be used to visualize data in a variety of...
IGOR Pro is a powerful data analysis and visualization software application developed by WaveMetrics. It uses an object-oriented approach, allowing users to analyze and process data interactively through a drag-and-drop workflow interface.Some key features of IGOR Pro include:Interactive 2D and 3D scientific graphing and publication-quality plottingA wide range of analysis...
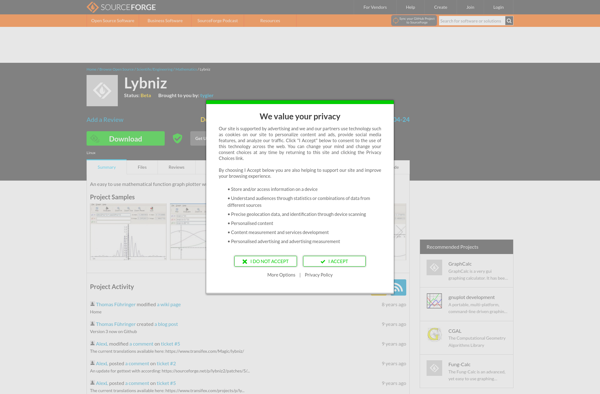
Lybniz is a free, open-source graphing calculator software for Windows, Linux and macOS operating systems. It provides an intuitive graphical user interface for drawing mathematical equations, functions and graphs on screen. As equations are typed or drawn with the mouse, Lybniz dynamically plots the corresponding graph, allowing for visualization and...
Autograph is software designed specifically for applying digital signatures to documents. It allows individuals and teams to sign PDFs, Word documents, and other file types electronically.Some key features of Autograph include:Intuitive drag-and-drop interface for adding signatures to PDFsRole-based signing workflows with sequential or parallel routing optionsBulk sending of documents for...
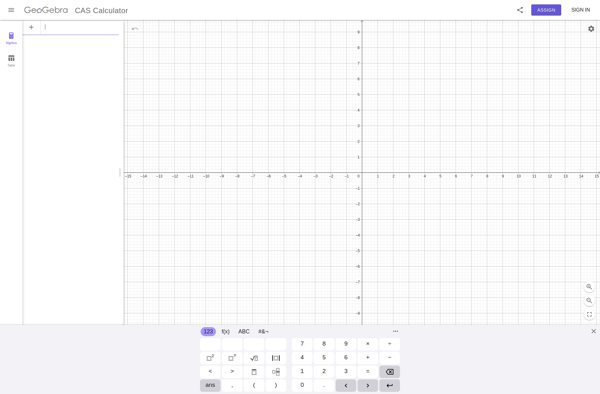
GeoGebra is a free, multi-platform dynamic mathematics software that joins geometry, algebra, tables, graphing, statistics and calculus in one easy-to-use package. It can be used for all levels of mathematics education from elementary through university level. Some of the key features of GeoGebra include:Graphing functions, inequalities, conic sectionsDynamic geometric constructions,...