DataGraph
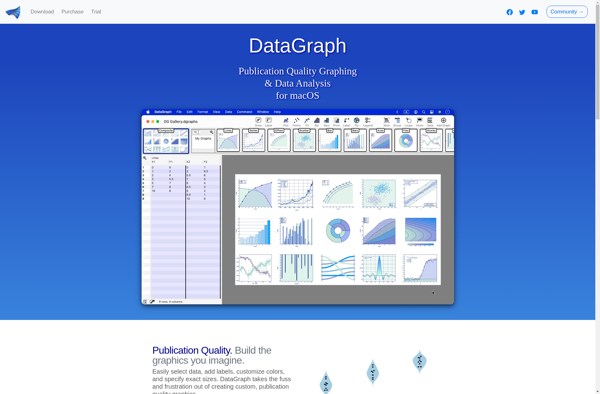
DataGraph is an open-source data visualization and analytics platform. It allows you to connect to data sources, build interactive visualizations and dashboards, and share analytics insights. DataGraph has a drag-and-drop interface to make chart building simple yet flexible.
DataGraph: Open-Source Data Visualization and Analytics Platform
Connect to data sources, build interactive visualizations and dashboards, and share analytics insights with DataGraph's drag-and-drop interface.
What is DataGraph?
DataGraph is an open-source business intelligence and analytics platform for building interactive data visualizations and dashboards. It provides a code-free environment using a user-friendly drag-and-drop interface that allows anyone to connect to data, build charts and graphs, create dashboards, and share analytics and insights.
Some key capabilities and benefits of DataGraph include:
- Flexible and customizable data visualizations - DataGraph allows users to create a wide variety of chart types including bar, line, scatter, pie, map, pivot table, gauge charts etc. These can be extensively customized via the UI.
- Ad-hoc reporting and analysis - Users can perform on-the-fly analytics by creating charts bound to underlying data on demand, applying filters, segments etc.
- Interactive dashboards - Multiple charts and graphs can be organized into elegant, interactive dashboards with advanced features like cross-filtering across visualizations.
- Data connectivity - DataGraph can connect to SQL & NoSQL databases, cloud data warehouse solutions, REST & streaming APIs etc. It supports live data connections.
- Collaboration - Dashboards and analytics can be securely shared with other DataGraph users supporting team collaboration.
- Open source software with active community - DataGraph is released under the AGPLv3 open source license with a vibrant community contributing to the project.
DataGraph Features
Features
- Drag-and-drop interface for building charts/visualizations
- Connects to various data sources like SQL, NoSQL, REST APIs
- Supports interactive dashboards with filters/parameters
- Has built-in geospatial and statistical analytics
- Allows sharing dashboards via links or embedding
- Has open source and commercial editions
Pricing
- Open Source
- Freemium
- Subscription-Based
Pros
Easy to use for non-technical users
Great for ad-hoc analytics and dashboarding
Integrates well with various data sources
Powerful visualization capabilities
Free open source option available
Cons
Steep learning curve for more advanced analysis
Limited built-in data preparation capabilities
Not ideal for large complex data pipelines
Open source version has limited features
Official Links
Reviews & Ratings
Login to ReviewThe Best DataGraph Alternatives
View all DataGraph alternatives with detailed comparison →
Top Data & Analytics and Data Visualization and other similar apps like DataGraph
Here are some alternatives to DataGraph:
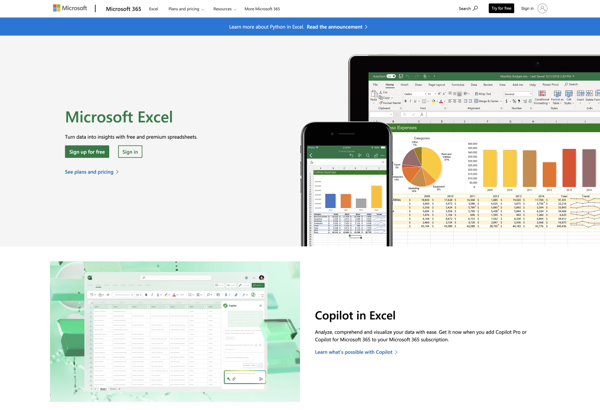
Suggest an alternative ❐Microsoft Excel
Microsoft Excel stands as the quintessential spreadsheet software, offering unparalleled versatility and functionality for individuals and businesses alike. A cornerstone of the Microsoft Office suite, Excel empowers users to organize, analyze, and interpret data efficiently. Its grid of cells allows for the creation of complex calculations, making it an indispensable...
LibreOffice - Calc
LibreOffice Calc is the spreadsheet component of the LibreOffice suite, offering users a robust, open-source alternative for managing and analyzing data. As part of the free and open-source software movement, LibreOffice Calc provides a cost-effective and feature-rich solution for individuals, businesses, and organizations looking to break away from proprietary spreadsheet...
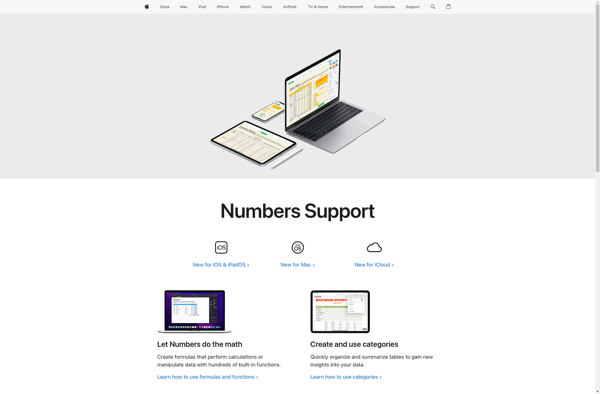
Numbers
Numbers is a spreadsheet application developed by Apple Inc. as part of its iWork productivity suite, along with Keynote and Pages. Numbers is available for both macOS and iOS operating systems.Numbers features an intuitive interface and offers tools for creating visually compelling spreadsheets. Key capabilities include:Customizable tables and chartsOver 250...
Wondershare EdrawMax
Wondershare EdrawMax is a comprehensive vector diagramming software suitable for business, education, and personal use. It provides abundant templates and symbols for flowcharts, org charts, mind maps, network diagrams, floor plans, fashion designs, UML diagrams, publish maps, infographics and more. With a user-friendly interface and smart drawing and formatting tools,...

GnuPlot
GnuPlot is a powerful, stable and free scientific graphing package with advanced capabilities. Developed originally for Unix-like operating systems, GnuPlot is now available for Windows, macOS and Linux.It can produce high-quality graphical visualizations of data from files or stdin, including simple x-y plots, histograms, contour plots, mesh plots, polar plots,...

Google Drawings
Google Drawings is a free online diagramming and charting tool offered by Google as part of its Google Workspace productivity suite. It allows users to create flowcharts, organizational charts, mind maps, concept maps, site maps, and other types of diagrams.Some key features of Google Drawings include:Intuitive drag-and-drop interface for easily...
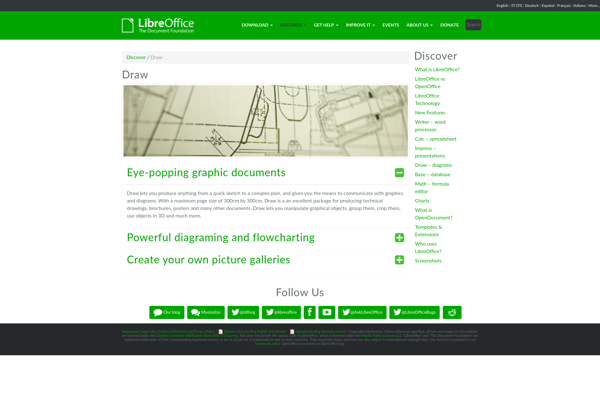
LibreOffice - Draw
LibreOffice Draw is a vector graphics editor included in the open source LibreOffice software suite. It allows users to create a wide variety of graphical images including diagrams, flowcharts, organizational charts, network layouts, floor plans, and more.As an open source alternative to Microsoft Visio, LibreOffice Draw provides many similar features...
Gnumeric
Gnumeric is an free, open source spreadsheet program created to be a lightweight alternative to software like Microsoft Excel. It is designed to provide many of the common features found in Excel while using less system resources and without expensive licensing fees.Some key features of Gnumeric include:Support for a wide...

KaleidaGraph
KaleidaGraph is a proprietary Windows-based 2D and 3D scientific data analysis and graphing software application specifically designed for scientists, engineers and technical enthusiasts who need to analyze and graph large volumes of data. First released in 1985 by Synergy Software, it has gone through continual development to the present version...
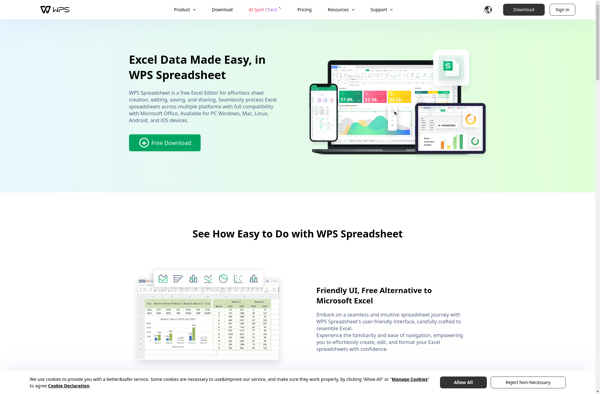
WPS Spreadsheet
WPS Spreadsheet is a feature-rich, free and open-source spreadsheet software that is considered one of the best alternatives to Microsoft Excel. It is developed by Chinese software developer Kingsoft.WPS Spreadsheet provides similar spreadsheet creation, calculation, data analysis and charting capabilities as Excel, packed in a fast, lightweight suite that can...
Matplotlib
Matplotlib is a comprehensive 2D plotting library for Python that enables users to create a wide variety of publication-quality graphs, charts, and visualizations. It supports many basic and advanced plotting functionalities and integrates well with NumPy and Pandas data structures.Matplotlib can be used to visualize data in a variety of...

Apache OpenOffice Calc
Apache OpenOffice Calc is a free, open source spreadsheet application that is part of the Apache OpenOffice software suite. It includes features similar to commercial spreadsheet programs like Microsoft Excel.Some key features and capabilities of Apache OpenOffice Calc include:Perform calculations and analyze data using formulas and functionsGenerate 2D and 3D...

Timeplotters
Timeplotters is a time tracking and productivity software designed to help users visualize how they spend their time. It has an intuitive interface that makes time tracking easy and even fun.Key features of Timeplotters include:Easy and automatic time tracking with the ability to track time down to the second.Colorful interactive...