Number Analytics is a data analytics and business intelligence software that specializes in working with numerical data. It provides tools for data preparation, analysis, visualization, and reporting to help users gain valuable insights.
Number Analytics: Data Analytics & Business Intelligence Software
Number Analytics is a data analytics and business intelligence software that specializes in working with numerical data. It provides tools for data preparation, analysis, visualization, and reporting to help users gain valuable insights.
What is Number Analytics?
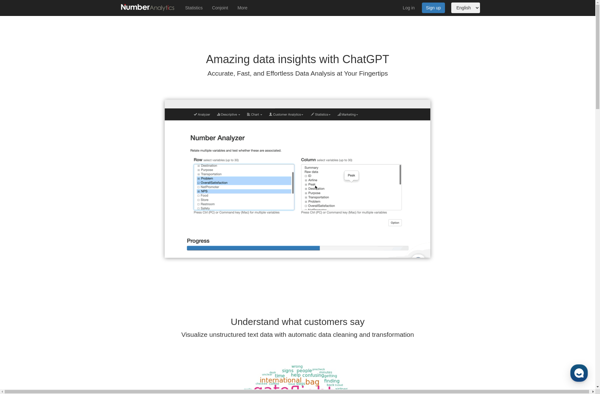
Number Analytics is a powerful data analytics and business intelligence platform designed specifically for working with numerical and quantitative data. It provides a wide range of features and capabilities for data preparation, statistical analysis, data visualization, and reporting.
Some of the key capabilities of Number Analytics include:
Data connectivity to import data from various sources such as SQL databases, cloud apps, spreadsheets, etc.
Data preparation tools for cleaning, transforming, and organizing numerical data.
Drag-and-drop interface for creating data visualizations such as charts, graphs, and dashboards.
Inbuilt statistical functions for descriptive, predictive, and prescriptive analytics.
Interactive reporting to share insights with stakeholders.
Collaboration capabilities for sharing reports, insights and annotations.
Number Analytics makes it easy for companies to unlock valuable insights from numerical data. Its easy-to-use interface allows business users without technical skills to prepare, analyze, visualize and obtain insights from complex data. With strong analytical capabilities tailored for numerical data, Number Analytics is an ideal solution for data-driven decision making.
Number Analytics Features
Features
Data Preparation: Provides tools for cleaning, transforming, and enriching numerical data
Data Analysis: Offers advanced analytical capabilities such as statistical analysis, forecasting, and trend identification
Data Visualization: Allows users to create interactive dashboards, charts, and reports to visualize data insights
Reporting and Exporting: Enables users to generate custom reports and export data in various formats
Collaboration and Sharing: Supports team-based collaboration and sharing of data and insights
Scalability and Performance: Designed to handle large datasets and provide fast processing and query capabilities
Pricing
Subscription-Based
Pros
Specialized in numerical data analysis
Comprehensive set of data preparation and analysis tools
Robust visualization and reporting capabilities
Collaborative features for team-based work
Scalable and performant for large-scale data processing
Cons
May not be as versatile for non-numerical data types
Potentially a steeper learning curve for users not familiar with data analytics
Pricing may be higher than some general-purpose business intelligence tools
R is an open-source programming language and free software environment for statistical computing, bioinformatics, graphics, data science, and general-purpose programming. The R language provides a wide variety of statistical analysis techniques and graphical capabilities which make it a popular choice for data analysis and visualization.Some key features of R include:Open-source...
IBM SPSS Statistics is a comprehensive software platform for statistical analysis in business, science, and social science research. First released in 1968, SPSS Statistics helps users apply complex statistical analyses and predictive analytics to unlock impactful insights from data.Key features and capabilities of SPSS Statistics include:Descriptive statistics like means, standard...
Minitab is a comprehensive software package used for statistical analysis and quality improvement applications. It has a wide range of analytical capabilities including basic statistics, regression analysis, design of experiments, statistical process control charts, reliability analysis, and more.Some key features and benefits of Minitab:User-friendly spreadsheet-style interface for entering, viewing, and...
RStudio is a popular open-source IDE for R, a programming language for statistical computing and graphics. It provides a user-friendly graphical user interface that makes working with R much easier by integrating tools for plotting, debugging, workspace management, and other features.Some key features of RStudio include:Code editor with syntax highlighting,...
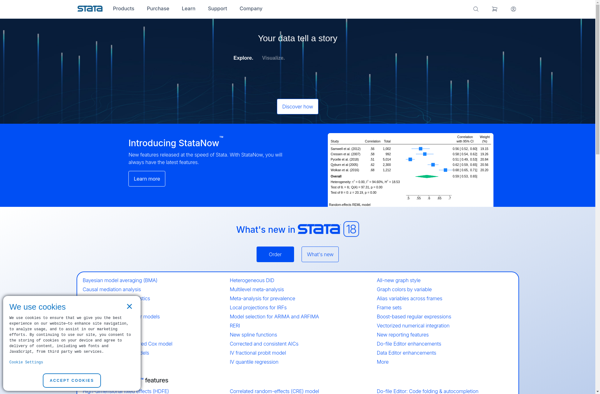
Stata is statistical software that is widely used by researchers in economics, political science, biomedicine, sociology, and other fields that require advanced statistical analysis and data visualization capabilities. It was first launched in 1985 by StataCorp and has since become one of the most popular statistical packages in academic research.Some...
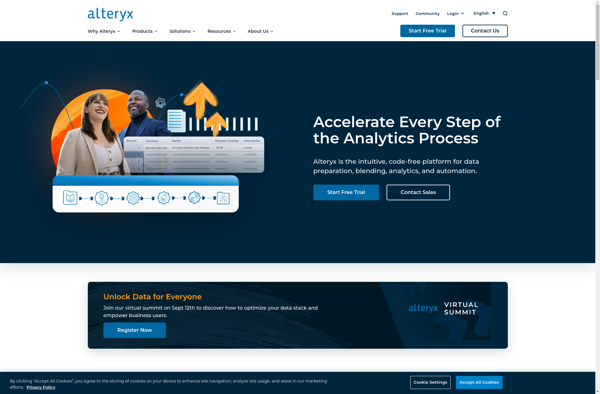
Alteryx is a data preparation and analytics software platform designed to make advanced data analytics accessible to any data worker. It provides an end-to-end platform to ingest, prepare, blend, analyze, and visualize data to gain deeper insights faster.Some key capabilities and benefits of Alteryx include:Intuitive drag-and-drop interface to prep and...
NumeRe is an open-source platform for numerical computing, data analysis, and scientific visualization. It provides a MATLAB-like environment and programming language focused on matrix operations, linear algebra routines, statistical analysis, and plotting. Some key features of NumeRe include:Fast vector/matrix math operations through integration of BLAS and LAPACK librariesA high-level scripting...
Deducer is a user-friendly open-source data analysis software aimed at beginners looking to learn statistics and data analysis using R without having to code. It was designed by academic researchers to be a free easy-to-use alternative to proprietary statistical software packages.Deducer provides a graphical user interface to R that allows...
PSPP is a free and open source alternative to the proprietary IBM SPSS Statistics software. It aims to provide similar capabilities and features for statistical analysis, data management, and graphics as SPSS Statistics does, while being available at no cost under the GNU General Public License.Some key features and capabilities...
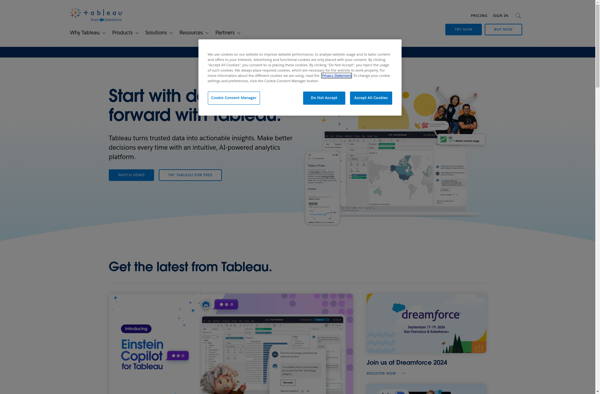
Tableau Prep is a self-service data preparation application designed to empower users to quickly and easily combine, shape, and clean their data to speed up analytics. Key features include:Intuitive visual interface - Tableau Prep allows users to eliminate complex coding and scripting to prepare data through visual steps and drag-and-drop...
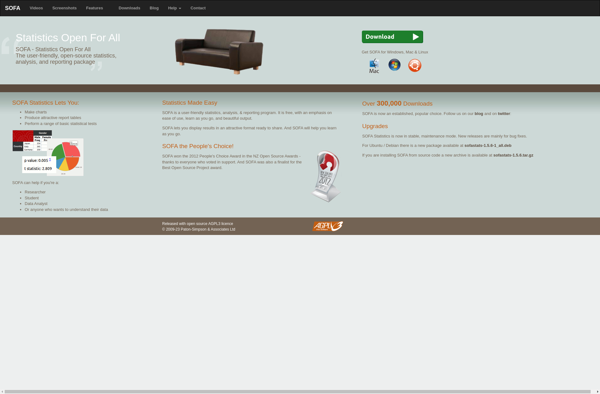
SOFA Statistics is a user-friendly, open-source statistics, analysis, and reporting tool that runs as a desktop application on Windows, Mac, and Linux. It provides an extensive range of statistical methods and visualization tools for exploratory data analysis, data cleaning, model fitting, results reporting, and dashboard creation.Some key features of SOFA...
The R Commander is a basic-statistics graphical user interface for R, an open source programming language and software environment for statistical analysis, data manipulation, and graphics visualization. The R Commander provides a simple way to utilize many R features through menus, dialog boxes, and other user interface controls rather than...
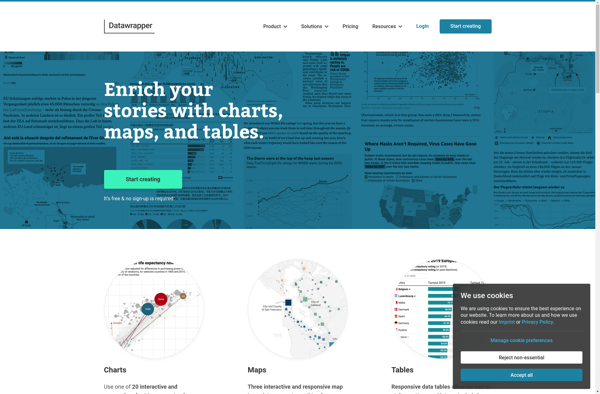
Datawrapper is a powerful yet user-friendly data visualization tool used by journalists, researchers, NGOs, and businesses to create interactive charts, graphs, and maps. Its drag-and-drop interface makes it easy for anyone to visualize data without needing to know how to code.Some key features of Datawrapper include:Various chart types including bar...
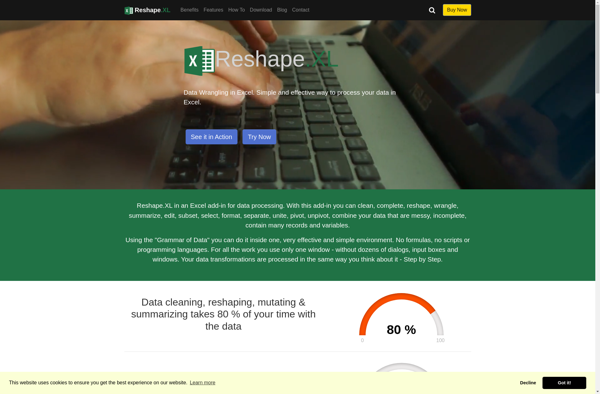
Reshape.XL is a powerful yet easy-to-use spreadsheet software application focused on data preparation and transformation. It allows users to easily combine, split, extract, delete and format data from multiple sources into a clean, consistent dataset without coding.Key features include:Intuitive point-and-click interface for shaping, cleansing and transforming spreadsheet dataTools for handling...
Revolution Analytics' Revolution R is a software environment and suite of tools designed to provide an enhanced user experience for the R programming language. Some key features of Revolution R include:Integrated Development Environment (IDE) - Provides an interface for authoring, debugging, and executing R code, with features like syntax highlighting,...
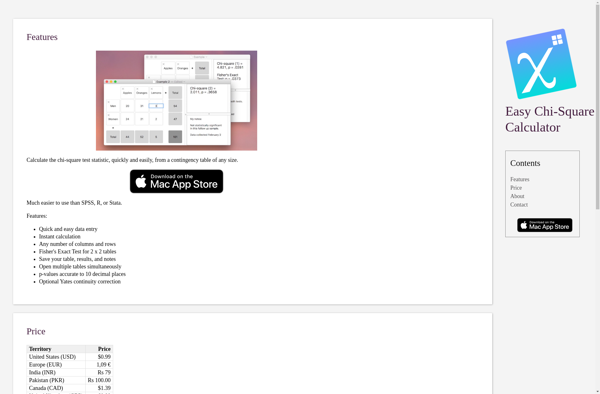
Easy Chi-Square Calculator is a user-friendly web application designed for easily and rapidly carrying out chi-square tests. It eliminates the need for manual chi-square calculations or looking up critical values in statistical tables. The tool allows entry of a contingency table by typing or pasting observed and expected frequency counts....