Revolution R
Revolution R is a commercial, cross-platform integrated development environment for the R programming language. It provides tools for data manipulation, visualization, and analysis. Revolution R aims to make R more accessible for new users.

Revolution R: Cross-Platform R Development Environment
Revolution R is a commercial integrated development environment for the R programming language, offering tools for data manipulation, visualization, and analysis, aiming to make R more accessible for new users.
What is Revolution R?
Revolution Analytics' Revolution R is a software environment and suite of tools designed to provide an enhanced user experience for the R programming language. Some key features of Revolution R include:
- Integrated Development Environment (IDE) - Provides an interface for authoring, debugging, and executing R code, with features like syntax highlighting, auto-complete, and help documentation.
- Enterprise administration tools - Allows control, administration, and deployment of R across an organization, with abilities like user authentication, access restrictions, and package management.
- Expanded data analytics capabilities - Additional statistical algorithms, predictive modeling techniques, and big data analytics tools to augment base R functionality.
- Performance monitoring and improvements - Features to monitor R program performance and identify optimization opportunities.
- Cross-platform support - Works across Windows, Mac, and Linux systems.
- Programming productivity tools - Helper functions, shortcuts, and interfaces to make R coding faster and easier for both new and expert users.
- Visualization & reporting features - Additional visualization types, dashboards, and reporting functionality to enable better understanding and communication of data insights.
Revolution R aims to make advanced analytics with R more accessible to a wider audience of users. It keeps R's flexibility while optimizing performance and simplifying administration to enable enterprise-scale deployment.
Revolution R Features
Features
- Code editor with syntax highlighting
- Integrated R interpreter
- Data viewer to examine data frames
- Visualization tools including charts and graphs
- Debugging capabilities
- Package management
- R help and documentation
Pricing
- Subscription-Based
Pros
Very powerful and full-featured IDE for R
Makes R more accessible for new users
Good for both coding and interactive use
Lots of tools for data analysis and visualization
Cross-platform support
Cons
Not free (paid license required)
Can be complex for brand new R users
Less customizable than RStudio
Requires license renewal/upgrades
Official Links
Reviews & Ratings
Login to ReviewThe Best Revolution R Alternatives
View all Revolution R alternatives with detailed comparison →
Top Development and Programming Languages and other similar apps like Revolution R
Here are some alternatives to Revolution R:
Suggest an alternative ❐R (programming language)
R is an open-source programming language and free software environment for statistical computing, bioinformatics, graphics, data science, and general-purpose programming. The R language provides a wide variety of statistical analysis techniques and graphical capabilities which make it a popular choice for data analysis and visualization.Some key features of R include:Open-source...

IBM SPSS Statistics
IBM SPSS Statistics is a comprehensive software platform for statistical analysis in business, science, and social science research. First released in 1968, SPSS Statistics helps users apply complex statistical analyses and predictive analytics to unlock impactful insights from data.Key features and capabilities of SPSS Statistics include:Descriptive statistics like means, standard...

Minitab
Minitab is a comprehensive software package used for statistical analysis and quality improvement applications. It has a wide range of analytical capabilities including basic statistics, regression analysis, design of experiments, statistical process control charts, reliability analysis, and more.Some key features and benefits of Minitab:User-friendly spreadsheet-style interface for entering, viewing, and...

RStudio
RStudio is a popular open-source IDE for R, a programming language for statistical computing and graphics. It provides a user-friendly graphical user interface that makes working with R much easier by integrating tools for plotting, debugging, workspace management, and other features.Some key features of RStudio include:Code editor with syntax highlighting,...

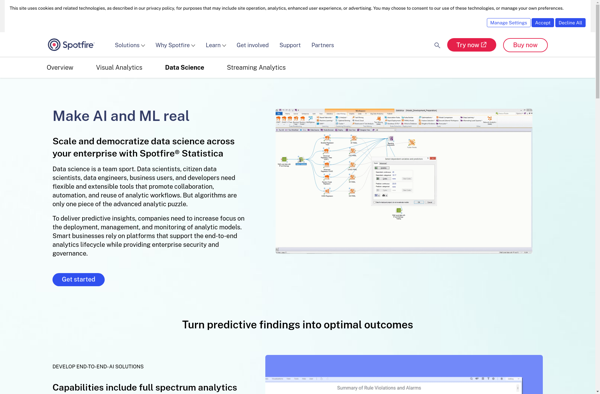
STATISTICA
STATISTICA is a powerful and comprehensive data analysis software suite that has been developed over 30+ years by StatSoft. It provides analytics capabilities for a wide range of industries and applications.Key features of STATISTICA include:Advanced data visualization with interactive dashboards, graphs and chartsPredictive analytics and data mining algorithms like regression,...
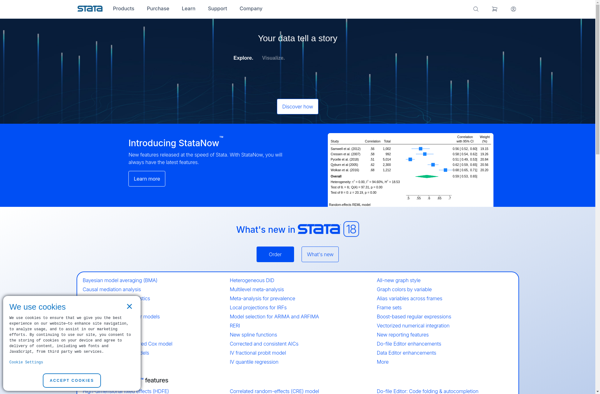
Stata
Stata is statistical software that is widely used by researchers in economics, political science, biomedicine, sociology, and other fields that require advanced statistical analysis and data visualization capabilities. It was first launched in 1985 by StataCorp and has since become one of the most popular statistical packages in academic research.Some...
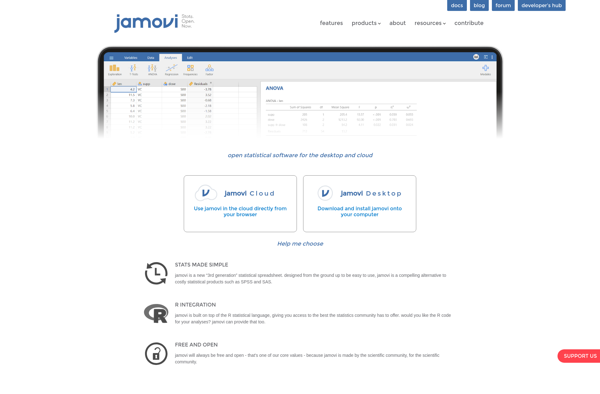
Jamovi
jamovi is an open-source and free statistical software that provides a user-friendly graphical user interface for conducting statistical analyses. It aims to make advanced analytics more accessible to students, researchers, and business users without requiring them to learn a programming language.Some key features of jamovi include:An intuitive and clean graphical...
The R Commander
The R Commander is a basic-statistics graphical user interface for R, an open source programming language and software environment for statistical analysis, data manipulation, and graphics visualization. The R Commander provides a simple way to utilize many R features through menus, dialog boxes, and other user interface controls rather than...

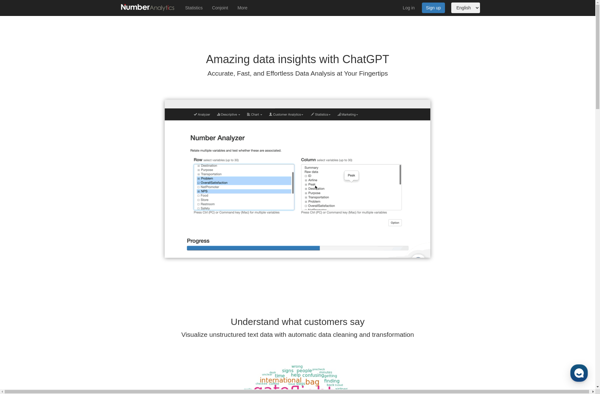
Number Analytics
Number Analytics is a powerful data analytics and business intelligence platform designed specifically for working with numerical and quantitative data. It provides a wide range of features and capabilities for data preparation, statistical analysis, data visualization, and reporting.Some of the key capabilities of Number Analytics include:Data connectivity to import data...
Chemoface
Chemoface is an open-source computer program for predicting the biological activities of chemical compounds. It utilizes machine learning models that have been trained on large datasets of chemicals and their associated bioassay data to predict potential therapeutic effects and safety risks.The key capabilities of Chemoface include:Predicting activity against a range...
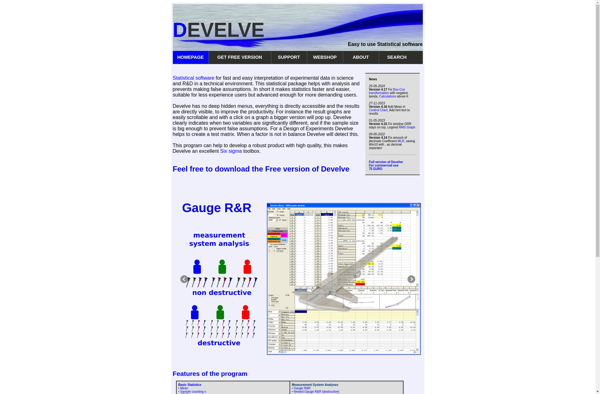
Develve
Develve is a flexible project management and bug tracking tool designed for agile software development teams. It provides a variety of features to plan, organize and track development projects, enabling seamless collaboration between team members.With Develve, you can:Manage user stories and tasks using kanban boardsTrack bugs and issues throughout the...
Neural Designer
Neural Designer is a software that enables development, simulation, and deployment of neural networks models for creating intelligent systems. It uses deep learning algorithms and techniques for fast creating accurate predictive models from large amounts of data. Key capabilities and features:Intuitive visual interface to design neural networks with drag-and-drop using...

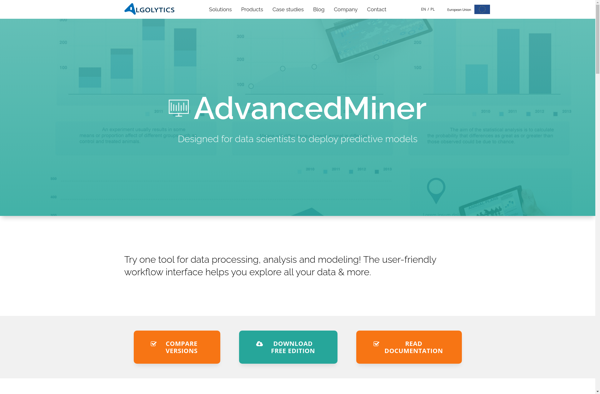
AdvancedMiner
AdvancedMiner is a comprehensive Bitcoin and cryptocurrency mining software that supports ASIC, GPU, and CPU mining. It provides a simplified graphical user interface, allowing miners of all levels to easily configure optimal settings for their particular mining hardware and chosen mining pools to maximize profitability.Some key features of AdvancedMiner include:...
PAST - PAlaeontological STatistics
PAST is a comprehensive, user-friendly software package for scientific data analysis, with a focus on paleontology and paleobiology research. Developed by researchers at the University of Oslo, PAST provides a wide range of analytical tools and statistical tests within an intuitive graphical user interface.Key features of PAST include:Data manipulation -...
R-Fiddle
R-Fiddle is an online integrated development environment (IDE) for the R programming language. It allows users to write, execute, and share R code from any web browser without having to install or configure any software locally.Some key features of R-Fiddle include:In-browser R console - Write and run R code interactivelyPre-loaded...
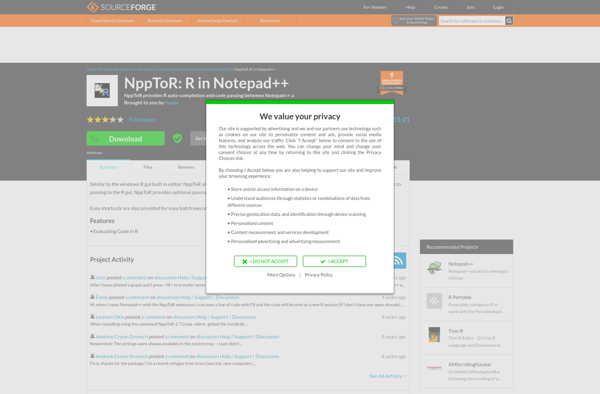
NppToR
NppToR is a handy plugin for Notepad++ that bridges the gap between editing R code and executing it. It allows you to send code from Notepad++ directly to an R terminal, capturing the results and output right back into Notepad++.Some key features of NppToR include:Send selections or entire R scripts...
QIWare
QIWare is an open-source business process management and workflow automation software designed to help organizations streamline operations, increase efficiency, and improve productivity. It provides a flexible no-code platform for creating, automating, managing, optimizing, and analyzing business processes and workflows.Key features of QIWare include:Intuitive drag-and-drop interface for building workflows visuallyPre-built templates...