jamovi

Jamovi

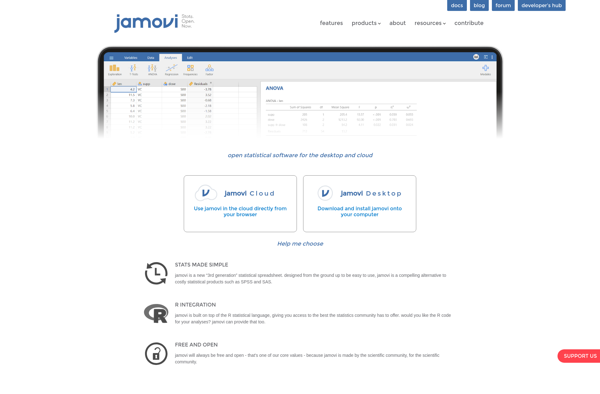
jamovi is an open-source statistical software that provides a user-friendly graphical user interface for conducting statistical analyses. It aims to make advanced analytics more accessible.
jamovi image
opensource gui statistics data-analysis

jamovi: Open-Source Statistical Software

An open-source statistical software with a user-friendly graphical user interface, aiming to make advanced analytics more accessible.

What is Jamovi?

jamovi is an open-source and free statistical software that provides a user-friendly graphical user interface for conducting statistical analyses. It aims to make advanced analytics more accessible to students, researchers, and business users without requiring them to learn a programming language.

Some key features of jamovi include:

  • An intuitive and clean graphical user interface that is easy to navigate.
  • A library of common statistical analyses including ANOVA, regression, principal component analysis, and t-tests.
  • Real-time output that updates automatically when inputs are changed.
  • The ability to import and wrangle many data formats including SPSS, SAS, Stata, CSV, Excel, and more.
  • An active community behind development and maintenance.
  • Extensibility through add-ons from the jamovi library.
  • Outputs that can be copied, exported, or embedded.

While jamovi may not have all the advanced or niche analyses available in paid solutions like SPSS or SAS, it provides an excellent free option for more basic and common analyses. Its graphical approach makes it accessible for those without programming experience.

Jamovi Features

Features

  1. Graphical user interface
  2. Point-and-click analysis
  3. R integration
  4. Reproducible analyses
  5. Collaboration tools
  6. Extensible via modules

Pricing

  • Open Source

Pros

Easy to use interface

Free and open source

Active development community

Runs natively on Windows, Mac, and Linux

Cons

Limited selection of analyses compared to R

Less flexibility than coding in R

Requires familiarity with statistics concepts


The Best Jamovi Alternatives

Top Statistics and Data Analysis and other similar apps like Jamovi


R (programming language) icon

R (programming language)

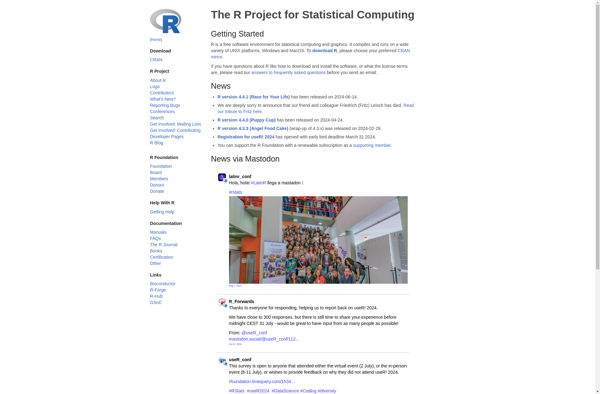
R is an open-source programming language and free software environment for statistical computing, bioinformatics, graphics, data science, and general-purpose programming. The R language provides a wide variety of statistical analysis techniques and graphical capabilities which make it a popular choice for data analysis and visualization.Some key features of R include:Open-source...
R (programming language) image
IBM SPSS Statistics icon

IBM SPSS Statistics

IBM SPSS Statistics is a comprehensive software platform for statistical analysis in business, science, and social science research. First released in 1968, SPSS Statistics helps users apply complex statistical analyses and predictive analytics to unlock impactful insights from data.Key features and capabilities of SPSS Statistics include:Descriptive statistics like means, standard...
IBM SPSS Statistics image
Minitab icon

Minitab

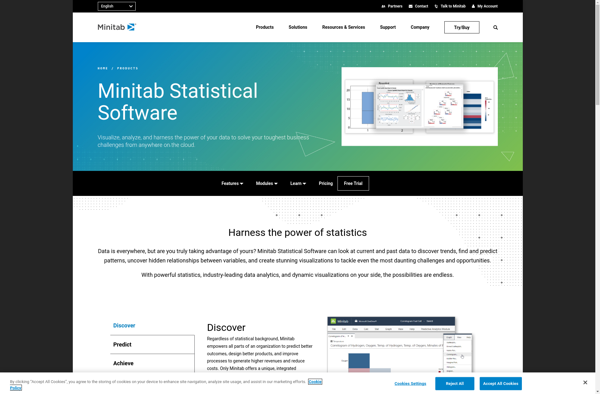
Minitab is a comprehensive software package used for statistical analysis and quality improvement applications. It has a wide range of analytical capabilities including basic statistics, regression analysis, design of experiments, statistical process control charts, reliability analysis, and more.Some key features and benefits of Minitab:User-friendly spreadsheet-style interface for entering, viewing, and...
Minitab image
Stata icon

Stata

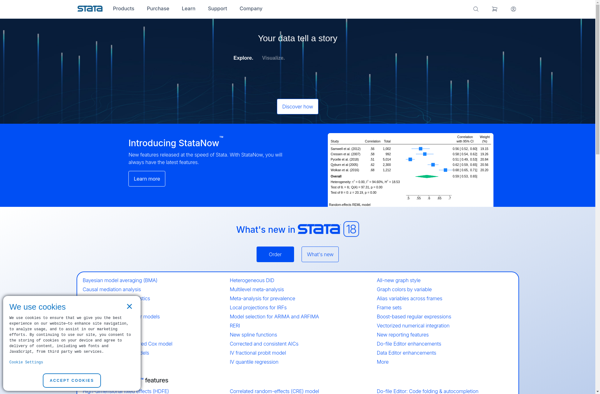
Stata is statistical software that is widely used by researchers in economics, political science, biomedicine, sociology, and other fields that require advanced statistical analysis and data visualization capabilities. It was first launched in 1985 by StataCorp and has since become one of the most popular statistical packages in academic research.Some...
Stata image
Deducer icon

Deducer

Deducer is a user-friendly open-source data analysis software aimed at beginners looking to learn statistics and data analysis using R without having to code. It was designed by academic researchers to be a free easy-to-use alternative to proprietary statistical software packages.Deducer provides a graphical user interface to R that allows...
Deducer image
RKWard icon

RKWard

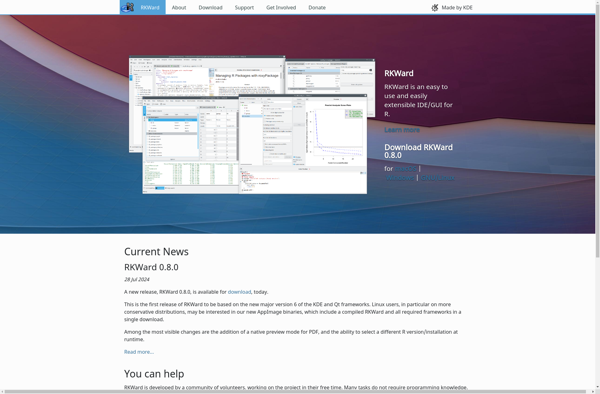
RKWard is a free and open-source integrated development environment for the R statistical programming language. It provides a graphical user interface that allows users to work with R without needing to manually type code.Some key features of RKWard include:Code editor with syntax highlighting, auto-completion and other productivity toolsData viewer to...
RKWard image
PSPP icon

PSPP

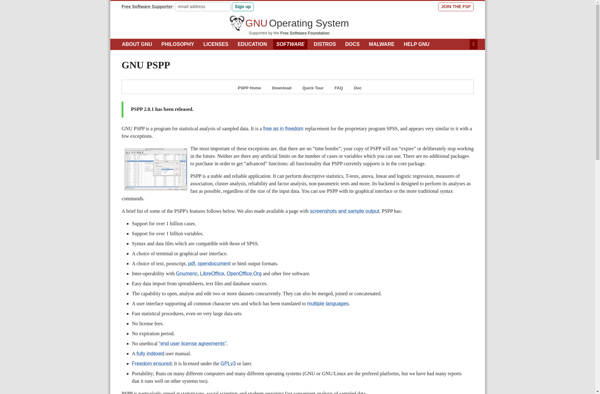
PSPP is a free and open source alternative to the proprietary IBM SPSS Statistics software. It aims to provide similar capabilities and features for statistical analysis, data management, and graphics as SPSS Statistics does, while being available at no cost under the GNU General Public License.Some key features and capabilities...
PSPP image
Montecarlito icon

Montecarlito

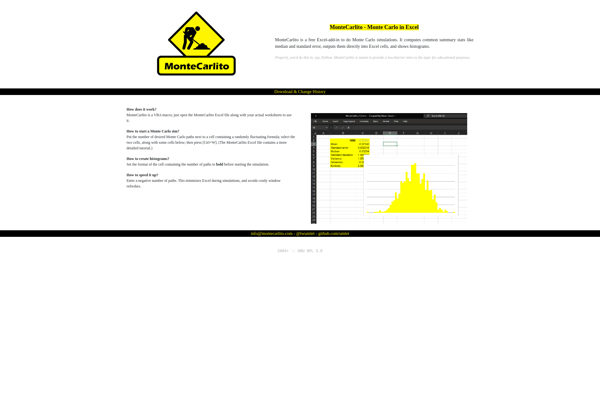
Montecarlito is an open-source typeface inspired by Times New Roman. It was created in 2018 by typographers Cadson Demak and Jacques Le Bailly to provide an alternative typeface that avoids the licensing restrictions of Times New Roman.Montecarlito has the same metrics as Times New Roman so it can be used...
Montecarlito image
SOFA Statistics icon

SOFA Statistics

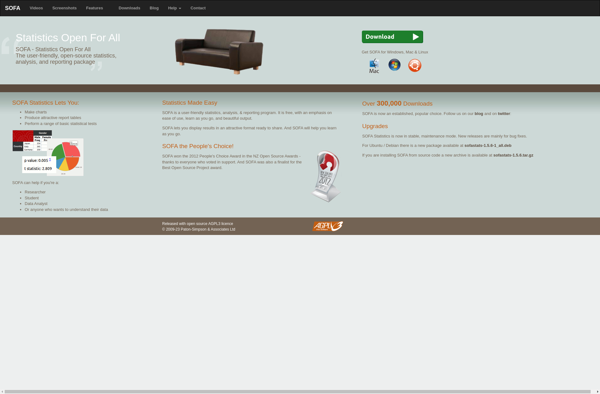
SOFA Statistics is a user-friendly, open-source statistics, analysis, and reporting tool that runs as a desktop application on Windows, Mac, and Linux. It provides an extensive range of statistical methods and visualization tools for exploratory data analysis, data cleaning, model fitting, results reporting, and dashboard creation.Some key features of SOFA...
SOFA Statistics image
BlueSky Statistics icon

BlueSky Statistics

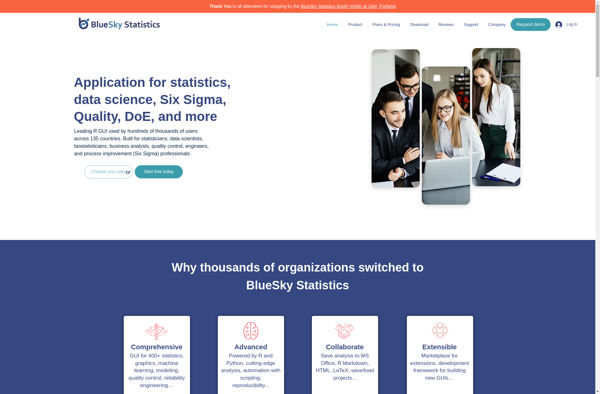
BlueSky Statistics is an open-source software application designed specifically for performing advanced data analysis and statistical modeling. It features a user-friendly graphical interface that allows users to easily explore, visualize, transform, and model their data without needing to know programming or statistical syntax.Some key capabilities of BlueSky Statistics include:Intuitive drag-and-drop...
BlueSky Statistics image
The R Commander icon

The R Commander

The R Commander is a basic-statistics graphical user interface for R, an open source programming language and software environment for statistical analysis, data manipulation, and graphics visualization. The R Commander provides a simple way to utilize many R features through menus, dialog boxes, and other user interface controls rather than...
The R Commander image
Revolution R icon

Revolution R

Revolution Analytics' Revolution R is a software environment and suite of tools designed to provide an enhanced user experience for the R programming language. Some key features of Revolution R include:Integrated Development Environment (IDE) - Provides an interface for authoring, debugging, and executing R code, with features like syntax highlighting,...
Revolution R image