Develve is a project management and bug tracking software for agile development teams. It allows managing user stories and tasks, tracking bugs and issues, planning sprints and releases, and visualizing workflows.
Develve is a project management and bug tracking software for agile development teams. It allows managing user stories and tasks, tracking bugs and issues, planning sprints and releases, and visualizing workflows.
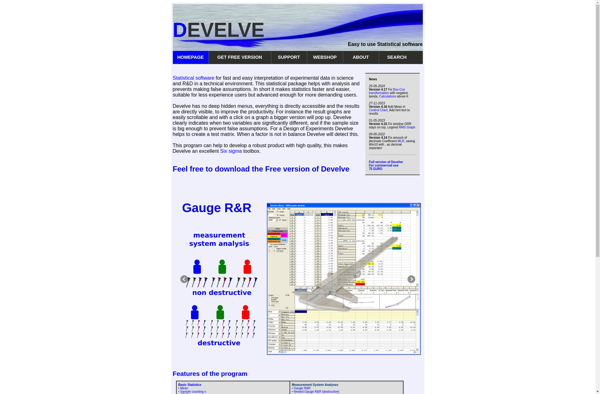
What is Develve?
Develve is a flexible project management and bug tracking tool designed for agile software development teams. It provides a variety of features to plan, organize and track development projects, enabling seamless collaboration between team members.
With Develve, you can:
Manage user stories and tasks using kanban boards
Track bugs and issues throughout the development lifecycle
Plan sprints and map out release schedules
Assign tasks and subtasks to team members
Set due dates and track progress in real-time
Visualize workflows with reports, burndown charts andcumulative flow diagrams
Integrate with version control systems like Git and SVN
Configure custom workflows to match your process
Collaborate across teams with file sharing,@-mentions and comments
Key benefits include real-time progress tracking, customizable boards and workflows, release planning tools, and mobile access to enable teams to coordinate regardless of location. With robust access controls and permissions, Develve provides visibility across the development process while allowing you to manage what each team member can view or edit.
R is an open-source programming language and free software environment for statistical computing, bioinformatics, graphics, data science, and general-purpose programming. The R language provides a wide variety of statistical analysis techniques and graphical capabilities which make it a popular choice for data analysis and visualization.Some key features of R include:Open-source...
Minitab is a comprehensive software package used for statistical analysis and quality improvement applications. It has a wide range of analytical capabilities including basic statistics, regression analysis, design of experiments, statistical process control charts, reliability analysis, and more.Some key features and benefits of Minitab:User-friendly spreadsheet-style interface for entering, viewing, and...
RStudio is a popular open-source IDE for R, a programming language for statistical computing and graphics. It provides a user-friendly graphical user interface that makes working with R much easier by integrating tools for plotting, debugging, workspace management, and other features.Some key features of RStudio include:Code editor with syntax highlighting,...
Deducer is a user-friendly open-source data analysis software aimed at beginners looking to learn statistics and data analysis using R without having to code. It was designed by academic researchers to be a free easy-to-use alternative to proprietary statistical software packages.Deducer provides a graphical user interface to R that allows...
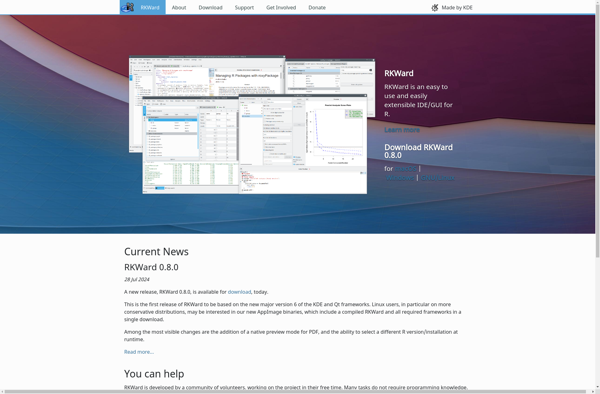
RKWard is a free and open-source integrated development environment for the R statistical programming language. It provides a graphical user interface that allows users to work with R without needing to manually type code.Some key features of RKWard include:Code editor with syntax highlighting, auto-completion and other productivity toolsData viewer to...
DOE++ is an open-source, extensible software framework designed to streamline and automate various aspects of the scientific research process. Some key features and capabilities of DOE++ include:Intuitive graphical user interface for designing experiments, including full factorial, fractional factorial, response surface, mixture, and custom designs.Seamless integration of data analysis tools like...
PSPP is a free and open source alternative to the proprietary IBM SPSS Statistics software. It aims to provide similar capabilities and features for statistical analysis, data management, and graphics as SPSS Statistics does, while being available at no cost under the GNU General Public License.Some key features and capabilities...
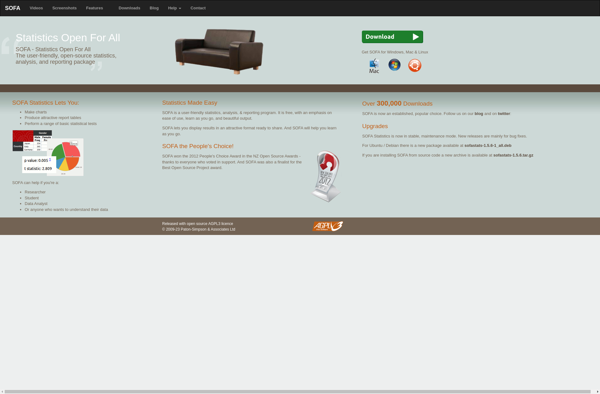
SOFA Statistics is a user-friendly, open-source statistics, analysis, and reporting tool that runs as a desktop application on Windows, Mac, and Linux. It provides an extensive range of statistical methods and visualization tools for exploratory data analysis, data cleaning, model fitting, results reporting, and dashboard creation.Some key features of SOFA...
SAS JMP is a comprehensive statistical analysis and data visualization software application developed by SAS Institute. It provides a visual and interactive platform for data analysis, enabling users to analyze data, build statistical and predictive models, and generate custom reports.Some key features and capabilities of JMP include:Interactive and dynamic graphs...
The R Commander is a basic-statistics graphical user interface for R, an open source programming language and software environment for statistical analysis, data manipulation, and graphics visualization. The R Commander provides a simple way to utilize many R features through menus, dialog boxes, and other user interface controls rather than...
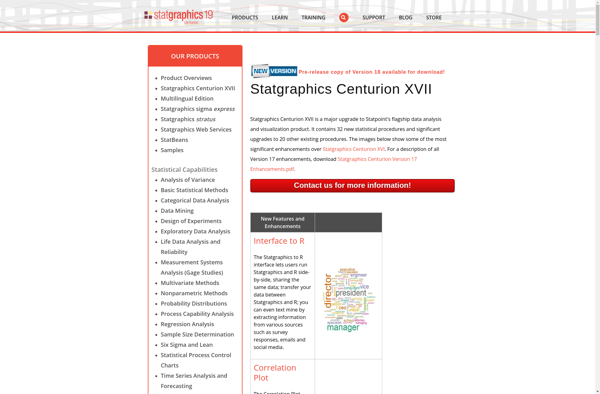
Statgraphics Centurion XVII is a comprehensive statistical data analysis and visualization software used by businesses, research organizations, quality improvement teams, and others to make data-driven decisions.It provides over 250 statistical procedures including analysis of variance, regression analysis, design of experiments, process capability analysis, multivariate data analysis, nonparametric tests, and more....
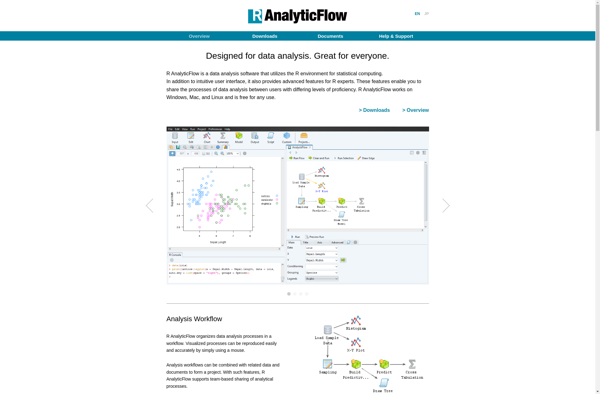
R AnalyticFlow is an open-source data analysis platform built specifically for the R programming language. It allows data scientists and analysts to create reusable analysis flows that connect various data sources, R scripts, and visualization code together into an end-to-end pipeline.Some key features of R AnalyticFlow include:Visual workflow editor -...
PAST is a comprehensive, user-friendly software package for scientific data analysis, with a focus on paleontology and paleobiology research. Developed by researchers at the University of Oslo, PAST provides a wide range of analytical tools and statistical tests within an intuitive graphical user interface.Key features of PAST include:Data manipulation -...
Dakota (Design Analysis Kit for Optimization and Terascale Applications) is an extensible open-source software for design optimization, parameter estimation, uncertainty quantification, and sensitivity analysis. It interfaces with simulation codes written in C, C++, Fortran, Python, and MATLAB.Some key capabilities of Dakota include:Optimization with gradient and non-gradient-based methods, heuristic techniques, hybrid...
Revolution Analytics' Revolution R is a software environment and suite of tools designed to provide an enhanced user experience for the R programming language. Some key features of Revolution R include:Integrated Development Environment (IDE) - Provides an interface for authoring, debugging, and executing R code, with features like syntax highlighting,...
SOSstat is an open-source statistical analysis program designed specifically for educational purposes in teaching statistics. It provides an easy-to-use interface allowing students to conduct basic statistical analyses and graphing without needing extensive statistical knowledge.Key features of SOSstat include:Conducting common statistical tests like t-tests, ANOVA, correlation, regression, and nonparametric testsGenerating graphs...