R AnalyticFlow is an open-source data science platform for R that allows you to create reusable analysis flows and deploy them at scale. It has a code-free GUI for building flows visually as well as integration with Git for version control.
An open-source data science platform for R, allowing you to create reusable analysis flows and deploy them at scale with a code-free GUI and Git integration.
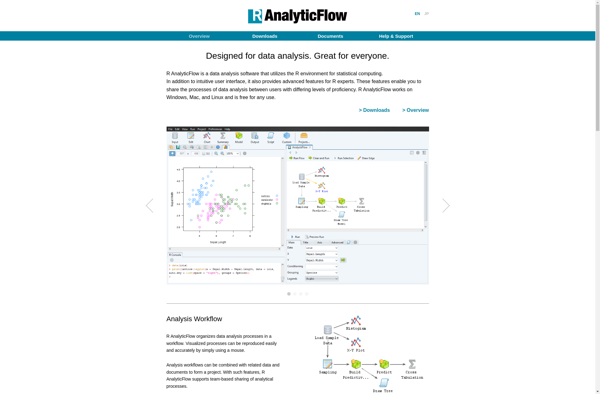
What is R AnalyticFlow?
R AnalyticFlow is an open-source data analysis platform built specifically for the R programming language. It allows data scientists and analysts to create reusable analysis flows that connect various data sources, R scripts, and visualization code together into an end-to-end pipeline.
Some key features of R AnalyticFlow include:
Visual workflow editor - Build workflows without writing code using a drag-and-drop GUI interface. Easily connect data sources, R scripts, models, visualizations, and other steps.
Version control integration - Seamlessly integrate with Git and GitHub for tracking changes and collaborating on workflow development.
Scheduled execution - Schedule workflows to run automatically on a recurring schedule for continuous data pipeline automation.
Scalable deployment - Deploy workflows into production at scale using Kubernetes and Docker without having to refactor any code.
Community-driven - R AnalyticFlow is open source and community driven, with many contributors adding new features and extensions.
Compared to general data science notebooks like RStudio, R AnalyticFlow is specifically optimized for workflow orchestration and deployment. The visual interface and reusable components make it easy to standardize analysis processes across teams. And its scalability makes it suitable for mission-critical applications in production environments.
R is an open-source programming language and free software environment for statistical computing, bioinformatics, graphics, data science, and general-purpose programming. The R language provides a wide variety of statistical analysis techniques and graphical capabilities which make it a popular choice for data analysis and visualization.Some key features of R include:Open-source...
Minitab is a comprehensive software package used for statistical analysis and quality improvement applications. It has a wide range of analytical capabilities including basic statistics, regression analysis, design of experiments, statistical process control charts, reliability analysis, and more.Some key features and benefits of Minitab:User-friendly spreadsheet-style interface for entering, viewing, and...
RStudio is a popular open-source IDE for R, a programming language for statistical computing and graphics. It provides a user-friendly graphical user interface that makes working with R much easier by integrating tools for plotting, debugging, workspace management, and other features.Some key features of RStudio include:Code editor with syntax highlighting,...
Deducer is a user-friendly open-source data analysis software aimed at beginners looking to learn statistics and data analysis using R without having to code. It was designed by academic researchers to be a free easy-to-use alternative to proprietary statistical software packages.Deducer provides a graphical user interface to R that allows...
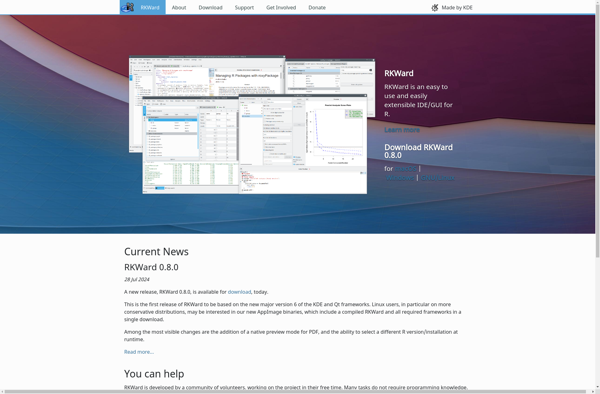
RKWard is a free and open-source integrated development environment for the R statistical programming language. It provides a graphical user interface that allows users to work with R without needing to manually type code.Some key features of RKWard include:Code editor with syntax highlighting, auto-completion and other productivity toolsData viewer to...
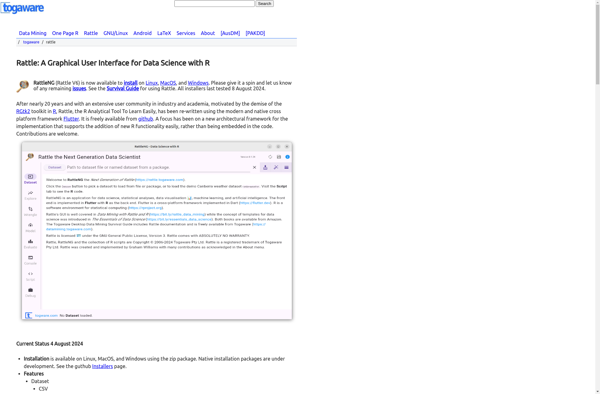
Rattle (the R Analytical Tool To Learn Easily) is an open-source graphical user interface for data mining that runs on the R statistical programming language. It allows users to visually create, evaluate, and refine data mining models without programming.Some key features of Rattle include:Interactive graphical interface for building workflows and...
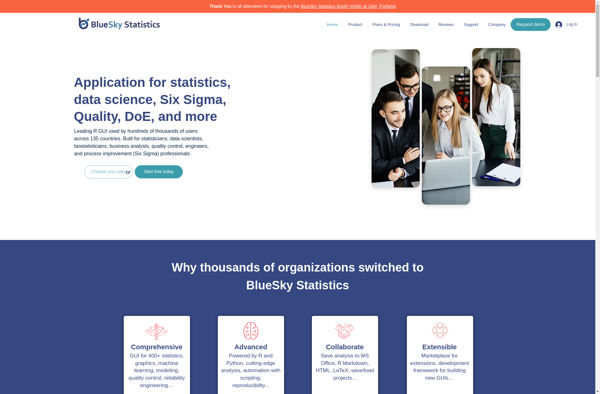
BlueSky Statistics is an open-source software application designed specifically for performing advanced data analysis and statistical modeling. It features a user-friendly graphical interface that allows users to easily explore, visualize, transform, and model their data without needing to know programming or statistical syntax.Some key capabilities of BlueSky Statistics include:Intuitive drag-and-drop...
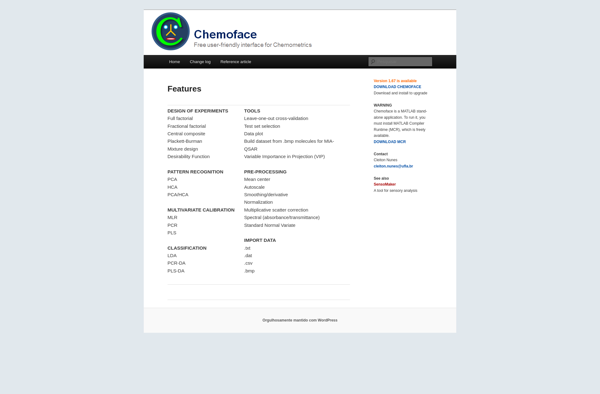
Chemoface is an open-source computer program for predicting the biological activities of chemical compounds. It utilizes machine learning models that have been trained on large datasets of chemicals and their associated bioassay data to predict potential therapeutic effects and safety risks.The key capabilities of Chemoface include:Predicting activity against a range...
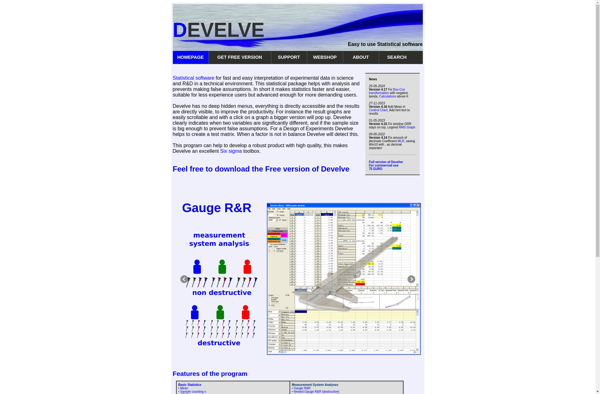
Develve is a flexible project management and bug tracking tool designed for agile software development teams. It provides a variety of features to plan, organize and track development projects, enabling seamless collaboration between team members.With Develve, you can:Manage user stories and tasks using kanban boardsTrack bugs and issues throughout the...
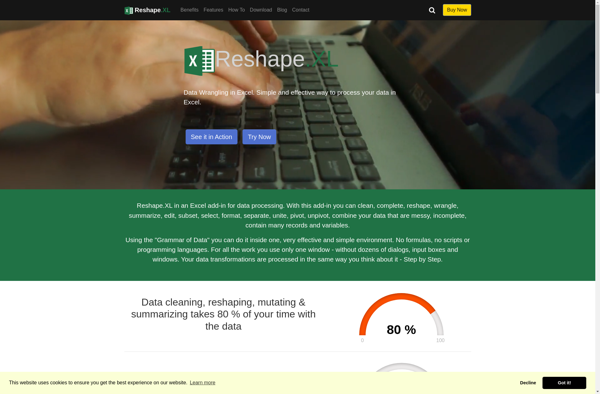
Reshape.XL is a powerful yet easy-to-use spreadsheet software application focused on data preparation and transformation. It allows users to easily combine, split, extract, delete and format data from multiple sources into a clean, consistent dataset without coding.Key features include:Intuitive point-and-click interface for shaping, cleansing and transforming spreadsheet dataTools for handling...
ggraptR is an R package that builds on ggplot2 to create specialized graphs for network analysis, geospatial data, and text analysis. It provides a grammar of graphics interface, making complex multivariate data visualization more accessible. Key features include:Network visualization - plot network graphs and trees with automatic layouts like force-directed,...
Dakota (Design Analysis Kit for Optimization and Terascale Applications) is an extensible open-source software for design optimization, parameter estimation, uncertainty quantification, and sensitivity analysis. It interfaces with simulation codes written in C, C++, Fortran, Python, and MATLAB.Some key capabilities of Dakota include:Optimization with gradient and non-gradient-based methods, heuristic techniques, hybrid...