Dakota

Dakota

Dakota is an open-source software for design optimization, parameter estimation, uncertainty quantification, and sensitivity analysis. It interfaces with simulation codes written in C, C++, Fortran, Python, and MATLAB.
Dakota image
optimization simulation uncertainty-quantification sensitivity-analysis

Dakota: Open-Source Design Optimization Software

Design optimization, parameter estimation, uncertainty quantification, and sensitivity analysis software - Dakota interfaces with simulation codes in C, C++, Fortran, Python, and MATLAB

What is Dakota?

Dakota (Design Analysis Kit for Optimization and Terascale Applications) is an extensible open-source software for design optimization, parameter estimation, uncertainty quantification, and sensitivity analysis. It interfaces with simulation codes written in C, C++, Fortran, Python, and MATLAB.

Some key capabilities of Dakota include:

  • Optimization with gradient and non-gradient-based methods, heuristic techniques, hybrid methods, and surrogate-based optimization
  • Uncertainty quantification with sampling, reliability, stochastic expansion, and epistemic methods
  • Parameter estimation using nonlinear least squares methods
  • Sensitivity analysis with design of experiments and parameter study methods

Dakota is developed by Sandia National Laboratories and made available under the GNU Lesser General Public License. It leverages parallel computing across multiple processors and computer clusters to solve complex simulation-based analysis problems efficiently.

Some application areas where Dakota has been effectively used are engineering design, risk analysis, calibration of computer models, and quantification of margins and uncertainty in simulations. It continues to be enhanced with state-of-the-art algorithms and methods.

Dakota Features

Features

  1. Design optimization
  2. Uncertainty quantification
  3. Parameter estimation
  4. Sensitivity analysis
  5. Interfaces with multiple simulation software

Pricing

  • Open Source

Pros

Open source

Wide range of analysis and optimization capabilities

Interfaces with many simulation codes

Active development community

Well documented

Cons

Steep learning curve

Requires coding/scripting for advanced features

Limited graphical user interface


The Best Dakota Alternatives

Top Development and Optimization & Simulation and other similar apps like Dakota


R (programming language) icon

R (programming language)

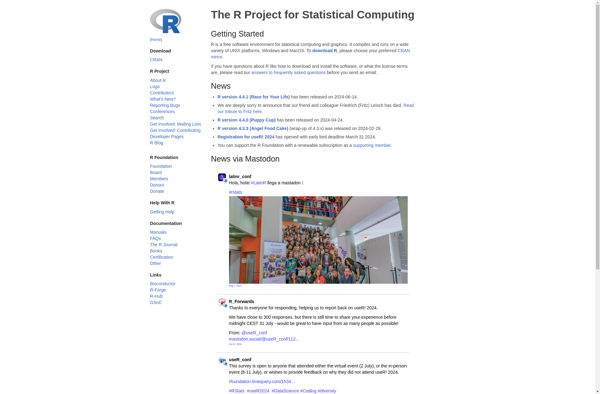
R is an open-source programming language and free software environment for statistical computing, bioinformatics, graphics, data science, and general-purpose programming. The R language provides a wide variety of statistical analysis techniques and graphical capabilities which make it a popular choice for data analysis and visualization.Some key features of R include:Open-source...
R (programming language) image
Minitab icon

Minitab

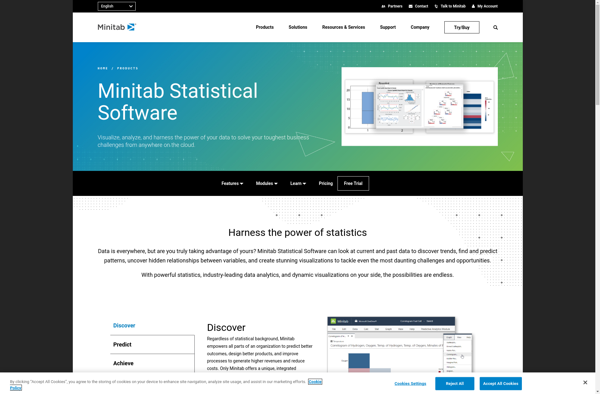
Minitab is a comprehensive software package used for statistical analysis and quality improvement applications. It has a wide range of analytical capabilities including basic statistics, regression analysis, design of experiments, statistical process control charts, reliability analysis, and more.Some key features and benefits of Minitab:User-friendly spreadsheet-style interface for entering, viewing, and...
Minitab image
RStudio icon

RStudio

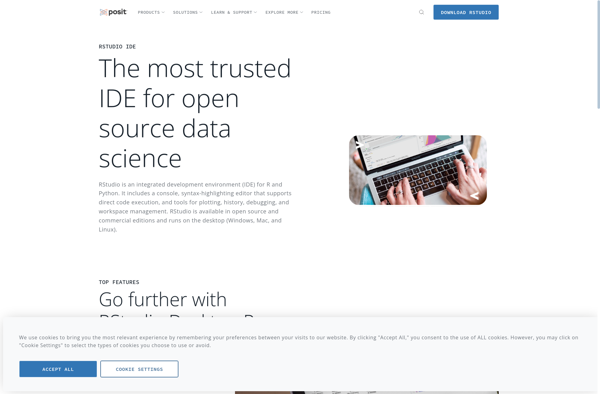
RStudio is a popular open-source IDE for R, a programming language for statistical computing and graphics. It provides a user-friendly graphical user interface that makes working with R much easier by integrating tools for plotting, debugging, workspace management, and other features.Some key features of RStudio include:Code editor with syntax highlighting,...
RStudio image
RKWard icon

RKWard

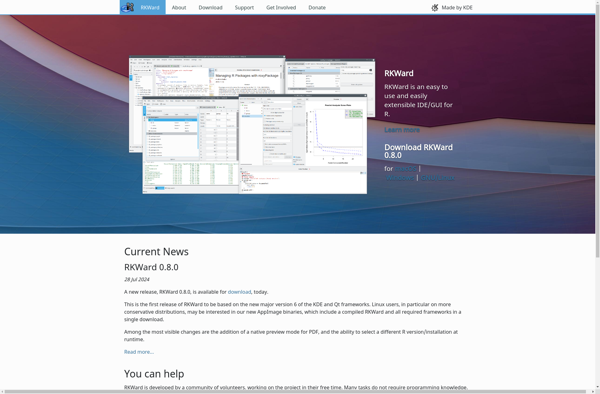
RKWard is a free and open-source integrated development environment for the R statistical programming language. It provides a graphical user interface that allows users to work with R without needing to manually type code.Some key features of RKWard include:Code editor with syntax highlighting, auto-completion and other productivity toolsData viewer to...
RKWard image
SAS JMP icon

SAS JMP

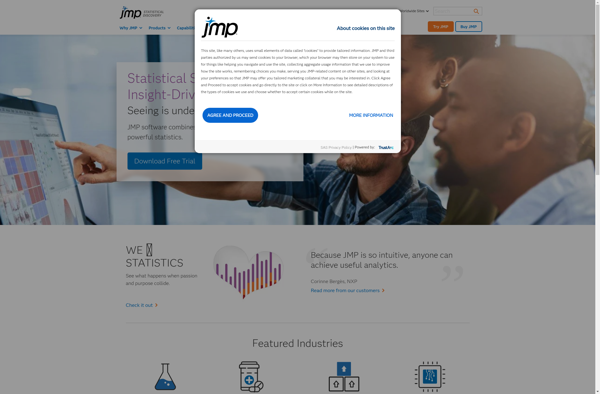
SAS JMP is a comprehensive statistical analysis and data visualization software application developed by SAS Institute. It provides a visual and interactive platform for data analysis, enabling users to analyze data, build statistical and predictive models, and generate custom reports.Some key features and capabilities of JMP include:Interactive and dynamic graphs...
SAS JMP image
The R Commander icon

The R Commander

The R Commander is a basic-statistics graphical user interface for R, an open source programming language and software environment for statistical analysis, data manipulation, and graphics visualization. The R Commander provides a simple way to utilize many R features through menus, dialog boxes, and other user interface controls rather than...
The R Commander image
Chemoface icon

Chemoface

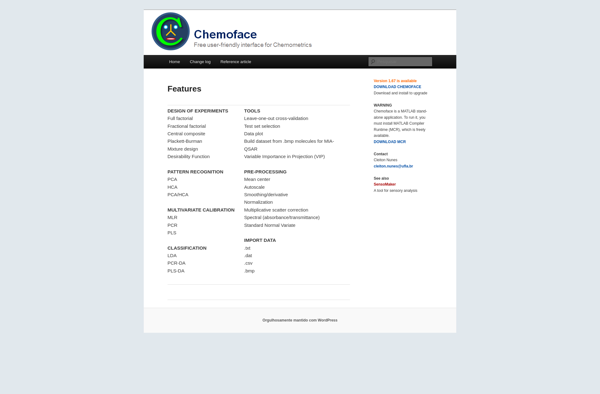
Chemoface is an open-source computer program for predicting the biological activities of chemical compounds. It utilizes machine learning models that have been trained on large datasets of chemicals and their associated bioassay data to predict potential therapeutic effects and safety risks.The key capabilities of Chemoface include:Predicting activity against a range...
Chemoface image
Develve icon

Develve

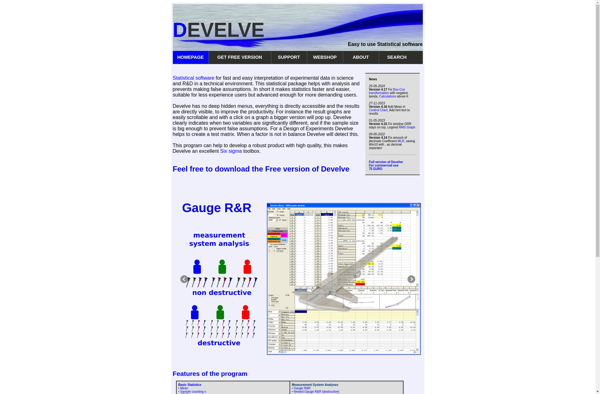
Develve is a flexible project management and bug tracking tool designed for agile software development teams. It provides a variety of features to plan, organize and track development projects, enabling seamless collaboration between team members.With Develve, you can:Manage user stories and tasks using kanban boardsTrack bugs and issues throughout the...
Develve image
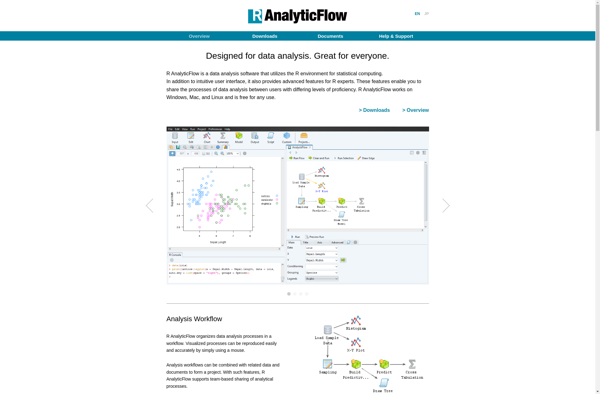
R AnalyticFlow icon

R AnalyticFlow

R AnalyticFlow is an open-source data analysis platform built specifically for the R programming language. It allows data scientists and analysts to create reusable analysis flows that connect various data sources, R scripts, and visualization code together into an end-to-end pipeline.Some key features of R AnalyticFlow include:Visual workflow editor -...
R AnalyticFlow image