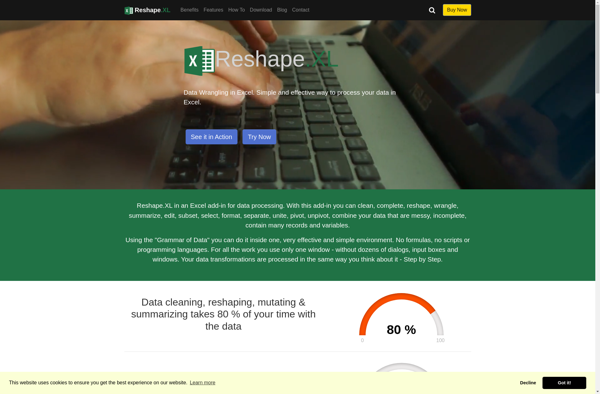
Reshape.XL is a spreadsheet software tool designed specifically for data preparation, cleaning and transformation. It simplifies working with complex, messy spreadsheets through an intuitive point-and-click interface.
Reshape.XL is a spreadsheet software tool designed specifically for data preparation, cleaning and transformation. It simplifies working with complex, messy spreadsheets through an intuitive point-and-click interface.
What is Reshape.XL?
Reshape.XL is a powerful yet easy-to-use spreadsheet software application focused on data preparation and transformation. It allows users to easily combine, split, extract, delete and format data from multiple sources into a clean, consistent dataset without coding.
Key features include:
Intuitive point-and-click interface for shaping, cleansing and transforming spreadsheet data
Tools for handling duplicates, missing values, formatting inconsistencies
Machine learning algorithms for data imputation, outlier detection and more
Connectivity to diverse data sources such as Excel, CSV files, databases
Collaboration capabilities for team-based data wrangling projects
Scripting and automation through JavaScript, Python, R and more
Export prepared datasets to analysis tools like Excel, Tableau, Power BI and more
With an emphasis on usability, Reshape.XL enables users of all technical skill levels to prepare high-quality, analysis-ready datasets faster than traditional spreadsheet software.
Reshape.XL Features
Features
Intuitive drag-and-drop interface for data transformation
Built-in data quality functions for cleaning, validating, and enhancing data
Support for complex operations like joins, appends, merges, pivots, and unpivots
Visual workflow designer to map out data transformation steps
Integration with Excel for easy importing and exporting
Collaboration features like sharing, commenting, and version control
Advanced data profiling for analyzing and understanding data
Data governance capabilities like data masking and encryption
APIs and scripting for advanced customization and automation
Pricing
Subscription-Based
Pros
More intuitive and visual than Excel for data prep
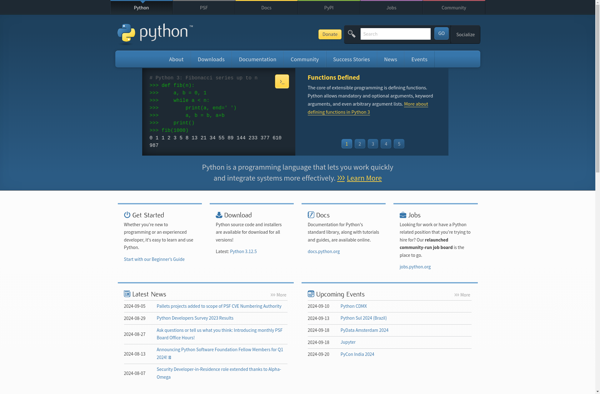
Python is a high-level, general-purpose programming language that emphasizes code readability and rapid application development. It was created by Guido van Rossum in 1991 and has since become one of the most popular programming languages.Some key features of Python include:Easy to learn syntax that resembles everyday EnglishInterpreted language that can...
R is an open-source programming language and free software environment for statistical computing, bioinformatics, graphics, data science, and general-purpose programming. The R language provides a wide variety of statistical analysis techniques and graphical capabilities which make it a popular choice for data analysis and visualization.Some key features of R include:Open-source...
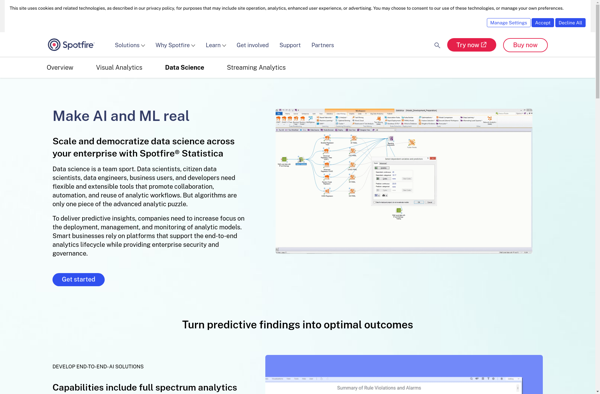
STATISTICA is a powerful and comprehensive data analysis software suite that has been developed over 30+ years by StatSoft. It provides analytics capabilities for a wide range of industries and applications.Key features of STATISTICA include:Advanced data visualization with interactive dashboards, graphs and chartsPredictive analytics and data mining algorithms like regression,...
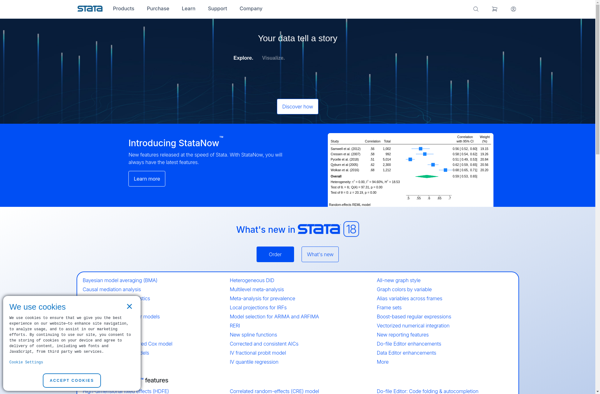
Stata is statistical software that is widely used by researchers in economics, political science, biomedicine, sociology, and other fields that require advanced statistical analysis and data visualization capabilities. It was first launched in 1985 by StataCorp and has since become one of the most popular statistical packages in academic research.Some...
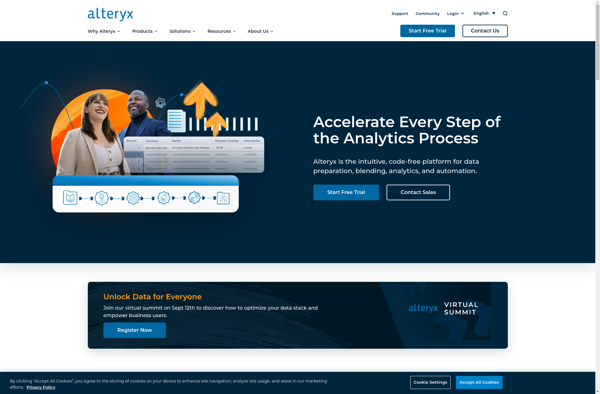
Alteryx is a data preparation and analytics software platform designed to make advanced data analytics accessible to any data worker. It provides an end-to-end platform to ingest, prepare, blend, analyze, and visualize data to gain deeper insights faster.Some key capabilities and benefits of Alteryx include:Intuitive drag-and-drop interface to prep and...
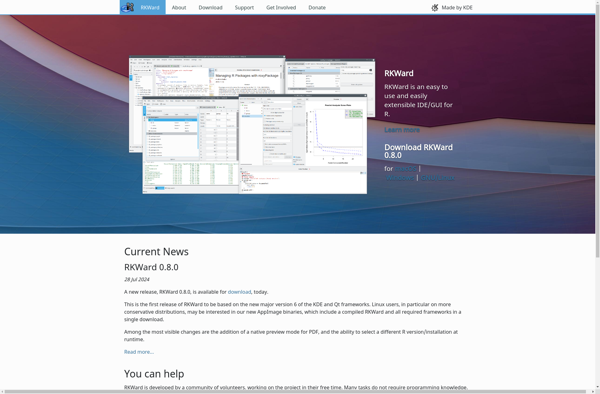
RKWard is a free and open-source integrated development environment for the R statistical programming language. It provides a graphical user interface that allows users to work with R without needing to manually type code.Some key features of RKWard include:Code editor with syntax highlighting, auto-completion and other productivity toolsData viewer to...
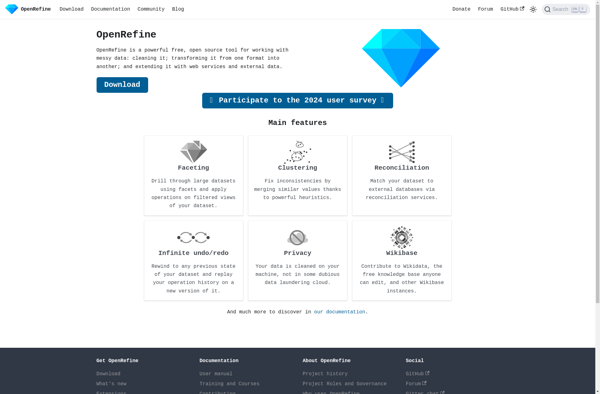
OpenRefine (formerly Google Refine) is a powerful open source tool for working with messy data. It allows you to quickly explore large datasets, clean inconsistencies in the data, transform data from one format to another, match datasets that are similar, and enrich data by linking it to other datasets.Some key...
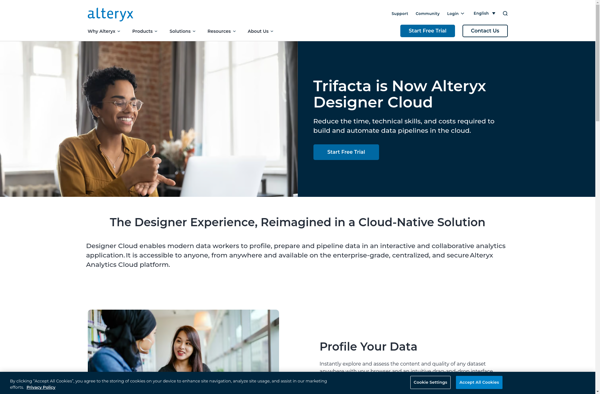
Trifacta is a cloud-native data preparation and analytics platform designed to help users prepare diverse and complex data for analysis and machine learning. It provides an intuitive, visual interface to profile, cleanse, structure, enrich and transform data at scale.Key capabilities and benefits of Trifacta include:Intuitive graphical interface to visualize and...
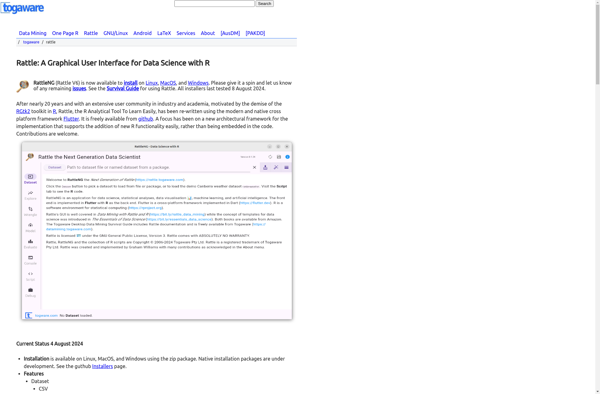
Rattle (the R Analytical Tool To Learn Easily) is an open-source graphical user interface for data mining that runs on the R statistical programming language. It allows users to visually create, evaluate, and refine data mining models without programming.Some key features of Rattle include:Interactive graphical interface for building workflows and...
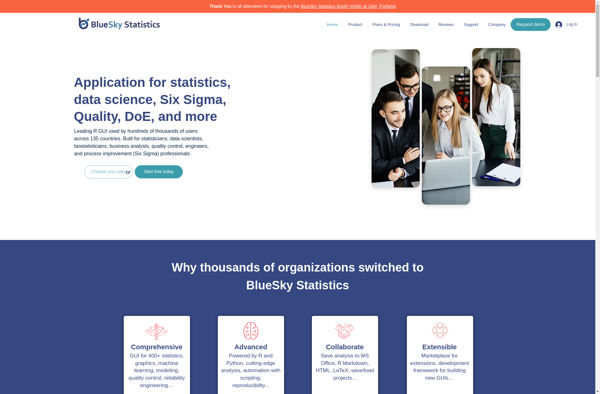
BlueSky Statistics is an open-source software application designed specifically for performing advanced data analysis and statistical modeling. It features a user-friendly graphical interface that allows users to easily explore, visualize, transform, and model their data without needing to know programming or statistical syntax.Some key capabilities of BlueSky Statistics include:Intuitive drag-and-drop...
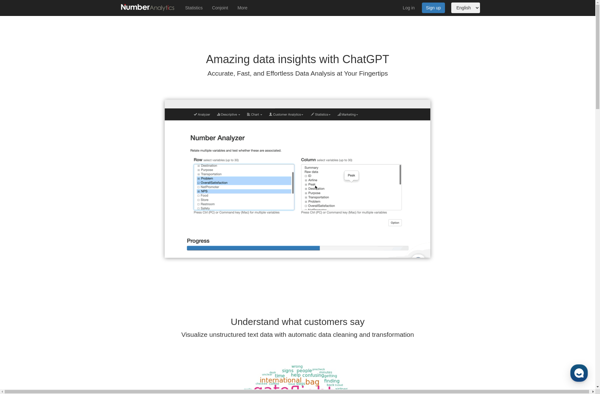
Number Analytics is a powerful data analytics and business intelligence platform designed specifically for working with numerical and quantitative data. It provides a wide range of features and capabilities for data preparation, statistical analysis, data visualization, and reporting.Some of the key capabilities of Number Analytics include:Data connectivity to import data...
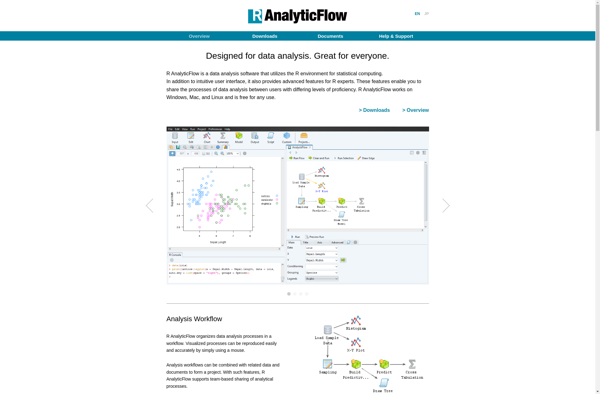
R AnalyticFlow is an open-source data analysis platform built specifically for the R programming language. It allows data scientists and analysts to create reusable analysis flows that connect various data sources, R scripts, and visualization code together into an end-to-end pipeline.Some key features of R AnalyticFlow include:Visual workflow editor -...
Data Wrangler is a visual data transformation application designed to help users intuitively clean and organize messy, complex data in preparation for analysis. It allows users to quickly parse, transform, match, merge, filter, combine, validate, and summarize data through an easy-to-use graphical interface.Key features of Data Wrangler include:Interactive transformation buttons...