Rattle is an open-source data mining GUI tool built on the statistical programming language R. It allows users to visually create, evaluate, and refine data mining models without programming.
An open-source data mining GUI tool built on R, allowing users to create, evaluate, and refine data mining models visually without programming.
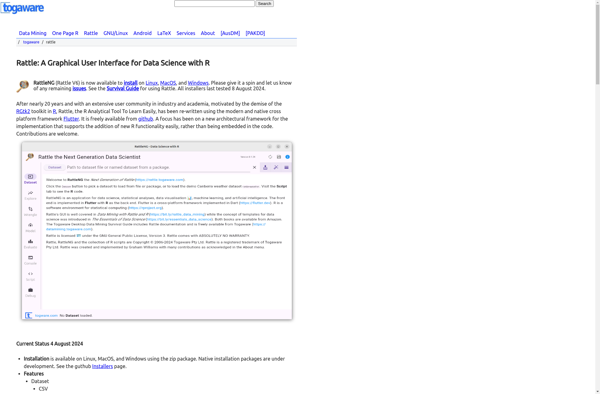
What is Rattle?
Rattle (the R Analytical Tool To Learn Easily) is an open-source graphical user interface for data mining that runs on the R statistical programming language. It allows users to visually create, evaluate, and refine data mining models without programming.
Some key features of Rattle include:
Interactive graphical interface for building workflows and models
Supports common data mining techniques like regression, clustering, association rules, decision trees, random forests, and more
Generates R code that can be exported, edited, and reused
Visualization tools for exploring data sets and evaluation model performance
Designed specifically for teaching and learning data mining concepts
Rattle is commonly used for rapid prototyping and model development as it allows analysts to quickly build and test models. While limited in advanced functionality compared to coding directly in R, its graphical workflow interface is useful for gaining intuition. Rattle generates reproducible R code as output.
Overall, Rattle makes data mining in R more accessible for beginning and intermediate users. Its focus on exploratory analysis and educational use cases has made it a popular choice for teaching data science students.
Rattle Features
Features
Graphical user interface for data mining using R
Supports data loading, transformation, visualization, modeling, evaluation and scoring
Includes plugins for text mining, forecasting, neural networks, and more
R is an open-source programming language and free software environment for statistical computing, bioinformatics, graphics, data science, and general-purpose programming. The R language provides a wide variety of statistical analysis techniques and graphical capabilities which make it a popular choice for data analysis and visualization.Some key features of R include:Open-source...
Minitab is a comprehensive software package used for statistical analysis and quality improvement applications. It has a wide range of analytical capabilities including basic statistics, regression analysis, design of experiments, statistical process control charts, reliability analysis, and more.Some key features and benefits of Minitab:User-friendly spreadsheet-style interface for entering, viewing, and...
RStudio is a popular open-source IDE for R, a programming language for statistical computing and graphics. It provides a user-friendly graphical user interface that makes working with R much easier by integrating tools for plotting, debugging, workspace management, and other features.Some key features of RStudio include:Code editor with syntax highlighting,...
Deducer is a user-friendly open-source data analysis software aimed at beginners looking to learn statistics and data analysis using R without having to code. It was designed by academic researchers to be a free easy-to-use alternative to proprietary statistical software packages.Deducer provides a graphical user interface to R that allows...
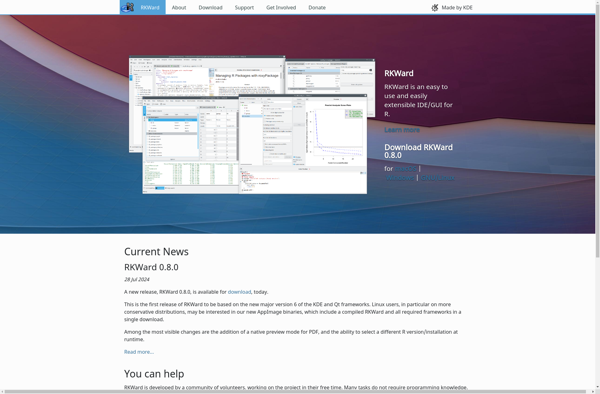
RKWard is a free and open-source integrated development environment for the R statistical programming language. It provides a graphical user interface that allows users to work with R without needing to manually type code.Some key features of RKWard include:Code editor with syntax highlighting, auto-completion and other productivity toolsData viewer to...
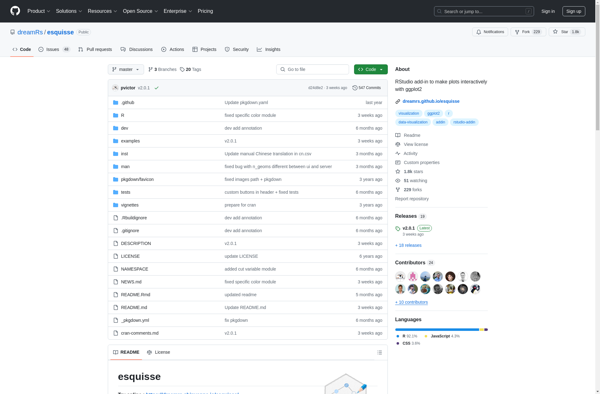
Esquisse is a free and open source painting and drawing application designed for the Linux operating system. It provides a simple but powerful set of tools for creating digital artwork from scratch.Some key features of Esquisse include:Intuitive user interface with a focus on ease of useSupport for multiple canvas sizes...
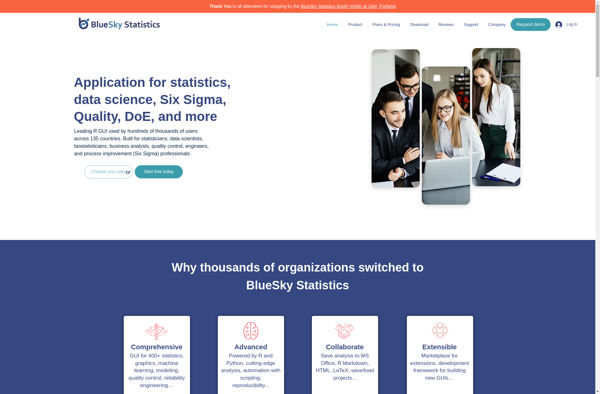
BlueSky Statistics is an open-source software application designed specifically for performing advanced data analysis and statistical modeling. It features a user-friendly graphical interface that allows users to easily explore, visualize, transform, and model their data without needing to know programming or statistical syntax.Some key capabilities of BlueSky Statistics include:Intuitive drag-and-drop...
The R Commander is a basic-statistics graphical user interface for R, an open source programming language and software environment for statistical analysis, data manipulation, and graphics visualization. The R Commander provides a simple way to utilize many R features through menus, dialog boxes, and other user interface controls rather than...
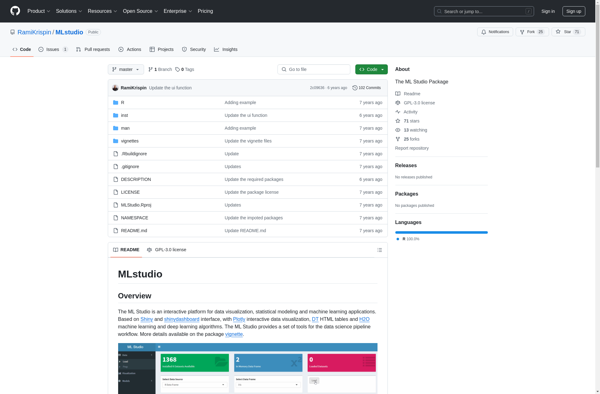
R MLstudio is an integrated development environment designed specifically for machine learning tasks in R. It provides a streamlined workflow that guides users through the end-to-end machine learning pipeline.Key features of R MLstudio include:Code editor with syntax highlighting, autocomplete, and other productivity enhancements for working with R codeData viewer for...
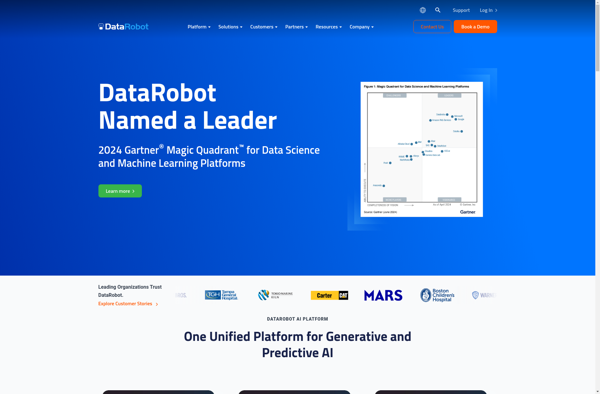
Datarobot is an end-to-end enterprise AI platform that aims to make machine learning more accessible for organizations. It provides a graphical user interface and automation tools that allow users without specialized data science skills to build, evaluate, and deploy machine learning models.Some key capabilities of Datarobot include:Automated machine learning -...
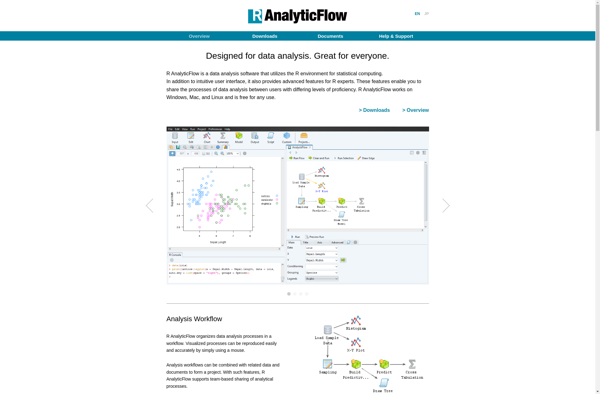
R AnalyticFlow is an open-source data analysis platform built specifically for the R programming language. It allows data scientists and analysts to create reusable analysis flows that connect various data sources, R scripts, and visualization code together into an end-to-end pipeline.Some key features of R AnalyticFlow include:Visual workflow editor -...
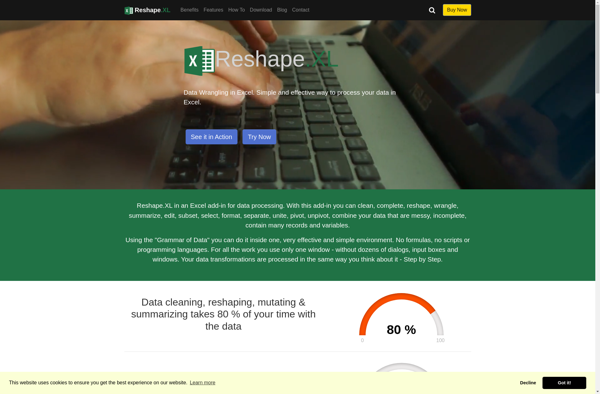
Reshape.XL is a powerful yet easy-to-use spreadsheet software application focused on data preparation and transformation. It allows users to easily combine, split, extract, delete and format data from multiple sources into a clean, consistent dataset without coding.Key features include:Intuitive point-and-click interface for shaping, cleansing and transforming spreadsheet dataTools for handling...
ggraptR is an R package that builds on ggplot2 to create specialized graphs for network analysis, geospatial data, and text analysis. It provides a grammar of graphics interface, making complex multivariate data visualization more accessible. Key features include:Network visualization - plot network graphs and trees with automatic layouts like force-directed,...