ggraptR is an R package that provides grammar of graphics style plotting using ggplot2 geoms. It aims to make complex multivariate data visualization easier and has functions for visualizing networks, geographic data, and textual data.
A R package providing grammar of graphics style plotting using ggplot2 geoms for easier multivariate data visualization, including functions for networks, geographic and textual data.
What is GgraptR?
ggraptR is an R package that builds on ggplot2 to create specialized graphs for network analysis, geospatial data, and text analysis. It provides a grammar of graphics interface, making complex multivariate data visualization more accessible. Key features include:
Network visualization - plot network graphs and trees with automatic layouts like force-directed, circular, etc.
Geospatial data mapping - easily make choropleth maps, dot density maps, flow maps with geographic data
Text visualization - create word clouds, word trees, sentiment roses to visualize unstructured text
Grammar of graphics interface - takes advantage of ggplot2's flexible and consistent design to customize all visualizations
Handles large graph and map data - optimized to plot tens of thousands of nodes and polygons smoothly
Overall, ggraptR makes creating publication-quality network and geographic visualizations much easier for users already familiar with ggplot2. It eliminates the need to learn different specialty graphing libraries and formats data correctly under one consistent framework.
GgraptR Features
Features
Provides grammar of graphics style plotting using ggplot2
Makes complex multivariate data visualization easier
Has functions for visualizing networks, geographic data, and textual data
Pricing
Open Source
Pros
Built on top of ggplot2, so inherits its flexibility and large user community
Intuitive syntax for generating complex plots
Specialised functions for visualizing particular data types
Cons
Less customizable than pure ggplot2
Smaller user community than ggplot2
Only useful if your data fits its specialised plotting functions
R is an open-source programming language and free software environment for statistical computing, bioinformatics, graphics, data science, and general-purpose programming. The R language provides a wide variety of statistical analysis techniques and graphical capabilities which make it a popular choice for data analysis and visualization.Some key features of R include:Open-source...
Minitab is a comprehensive software package used for statistical analysis and quality improvement applications. It has a wide range of analytical capabilities including basic statistics, regression analysis, design of experiments, statistical process control charts, reliability analysis, and more.Some key features and benefits of Minitab:User-friendly spreadsheet-style interface for entering, viewing, and...
RStudio is a popular open-source IDE for R, a programming language for statistical computing and graphics. It provides a user-friendly graphical user interface that makes working with R much easier by integrating tools for plotting, debugging, workspace management, and other features.Some key features of RStudio include:Code editor with syntax highlighting,...
Deducer is a user-friendly open-source data analysis software aimed at beginners looking to learn statistics and data analysis using R without having to code. It was designed by academic researchers to be a free easy-to-use alternative to proprietary statistical software packages.Deducer provides a graphical user interface to R that allows...
RKWard is a free and open-source integrated development environment for the R statistical programming language. It provides a graphical user interface that allows users to work with R without needing to manually type code.Some key features of RKWard include:Code editor with syntax highlighting, auto-completion and other productivity toolsData viewer to...
Rattle (the R Analytical Tool To Learn Easily) is an open-source graphical user interface for data mining that runs on the R statistical programming language. It allows users to visually create, evaluate, and refine data mining models without programming.Some key features of Rattle include:Interactive graphical interface for building workflows and...
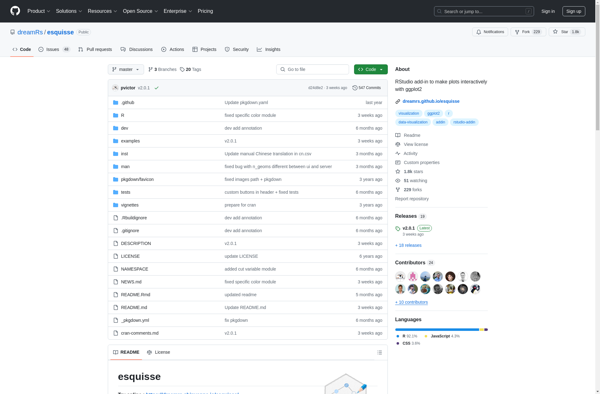
Esquisse is a free and open source painting and drawing application designed for the Linux operating system. It provides a simple but powerful set of tools for creating digital artwork from scratch.Some key features of Esquisse include:Intuitive user interface with a focus on ease of useSupport for multiple canvas sizes...
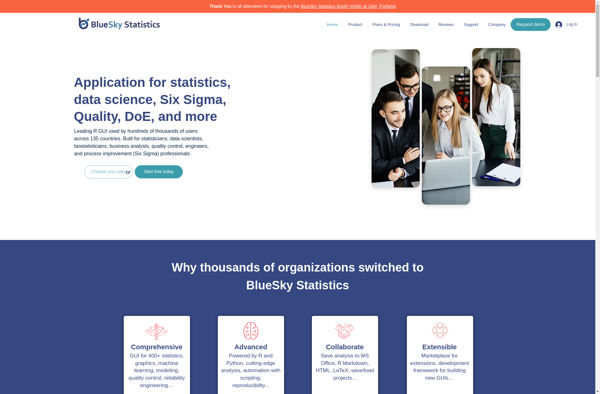
BlueSky Statistics is an open-source software application designed specifically for performing advanced data analysis and statistical modeling. It features a user-friendly graphical interface that allows users to easily explore, visualize, transform, and model their data without needing to know programming or statistical syntax.Some key capabilities of BlueSky Statistics include:Intuitive drag-and-drop...
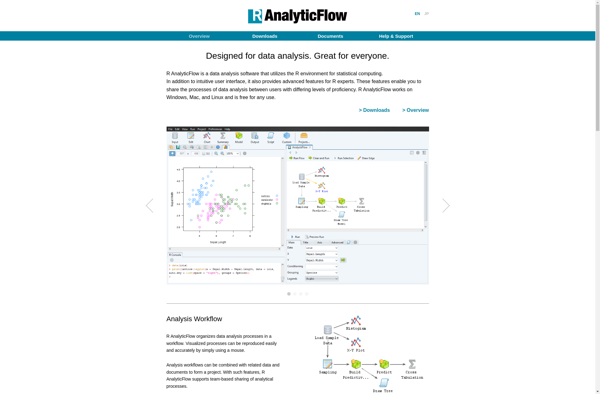
R AnalyticFlow is an open-source data analysis platform built specifically for the R programming language. It allows data scientists and analysts to create reusable analysis flows that connect various data sources, R scripts, and visualization code together into an end-to-end pipeline.Some key features of R AnalyticFlow include:Visual workflow editor -...