SOSstat is open-source statistical analysis software focused on statistics education. It provides an accessible interface for basic statistical tests and graphing tools to support teaching introductory statistics concepts.
SOSstat is open-source statistical analysis software focused on statistics education. It provides an accessible interface for basic statistical tests and graphing tools to support teaching introductory statistics concepts.
What is SOSstat?
SOSstat is an open-source statistical analysis program designed specifically for educational purposes in teaching statistics. It provides an easy-to-use interface allowing students to conduct basic statistical analyses and graphing without needing extensive statistical knowledge.
Key features of SOSstat include:
Conducting common statistical tests like t-tests, ANOVA, correlation, regression, and nonparametric tests
Generating graphs and plots such as histograms, scatter plots, bar charts, box plots, dot plots, and normal probability plots
Analyzing data from common formats like Excel and CSV files
Generating summary statistics of data sets
Creating customized reports
Step-by-step wizards for guiding students through analysis processes
A modular, user-friendly interface focused specifically on core statistical concepts appropriate for statistics education
SOSstat aims to make the process of learning, understanding, and applying statistical analysis accessible for students. Its design and functionality are optimized for enabling hands-on practice of statistics in line with typical introductory statistics curricula requirements.
SOSstat Features
Features
User-friendly graphical interface
Supports basic statistical analyses like t-tests, ANOVA, regression, etc
Generates various plots and graphs
Built-in statistics textbook and lessons
Can handle data in multiple formats like CSV and Excel
Open source and free to use
Pricing
Open Source
Pros
Easy to use for beginners
Completely free with no limits
Good for teaching basic statistics
Includes lessons and educational content
Cross-platform compatibility
Cons
Limited to basic statistical tests
Not suitable for advanced analyses
Fewer features than proprietary software like SPSS
Lacks some advanced graphing and visualization options
OriginPro is a powerful data analysis and graphing software designed for scientists, engineers, and analysts across various industries. It is developed by OriginLab Corporation for analyzing, graphing, and presenting scientific data.Some of the key features of OriginPro include:An extensive selection of analysis tools like peak analysis, surface fitting, statistics, signal...
Minitab is a comprehensive software package used for statistical analysis and quality improvement applications. It has a wide range of analytical capabilities including basic statistics, regression analysis, design of experiments, statistical process control charts, reliability analysis, and more.Some key features and benefits of Minitab:User-friendly spreadsheet-style interface for entering, viewing, and...
STATISTICA is a powerful and comprehensive data analysis software suite that has been developed over 30+ years by StatSoft. It provides analytics capabilities for a wide range of industries and applications.Key features of STATISTICA include:Advanced data visualization with interactive dashboards, graphs and chartsPredictive analytics and data mining algorithms like regression,...
Stata is statistical software that is widely used by researchers in economics, political science, biomedicine, sociology, and other fields that require advanced statistical analysis and data visualization capabilities. It was first launched in 1985 by StataCorp and has since become one of the most popular statistical packages in academic research.Some...
DOE++ is an open-source, extensible software framework designed to streamline and automate various aspects of the scientific research process. Some key features and capabilities of DOE++ include:Intuitive graphical user interface for designing experiments, including full factorial, fractional factorial, response surface, mixture, and custom designs.Seamless integration of data analysis tools like...
PSPP is a free and open source alternative to the proprietary IBM SPSS Statistics software. It aims to provide similar capabilities and features for statistical analysis, data management, and graphics as SPSS Statistics does, while being available at no cost under the GNU General Public License.Some key features and capabilities...
Design-Expert is a comprehensive software platform for design of experiments (DOE), response surface methodology (RSM), optimization, and statistical analysis. It enables engineers, scientists, and researchers to:Design experiments including factorial, response surface, mixture, and Taguchi designsEvaluate effects of factors and factor interactions on responsesOptimize product performance, quality, and cost using numerical...
SAS JMP is a comprehensive statistical analysis and data visualization software application developed by SAS Institute. It provides a visual and interactive platform for data analysis, enabling users to analyze data, build statistical and predictive models, and generate custom reports.Some key features and capabilities of JMP include:Interactive and dynamic graphs...
The R Commander is a basic-statistics graphical user interface for R, an open source programming language and software environment for statistical analysis, data manipulation, and graphics visualization. The R Commander provides a simple way to utilize many R features through menus, dialog boxes, and other user interface controls rather than...
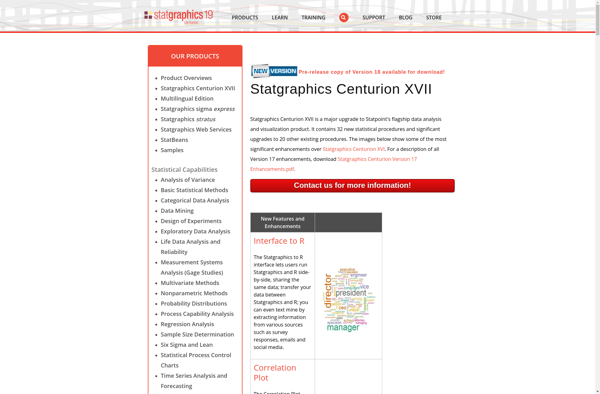
Statgraphics Centurion XVII is a comprehensive statistical data analysis and visualization software used by businesses, research organizations, quality improvement teams, and others to make data-driven decisions.It provides over 250 statistical procedures including analysis of variance, regression analysis, design of experiments, process capability analysis, multivariate data analysis, nonparametric tests, and more....
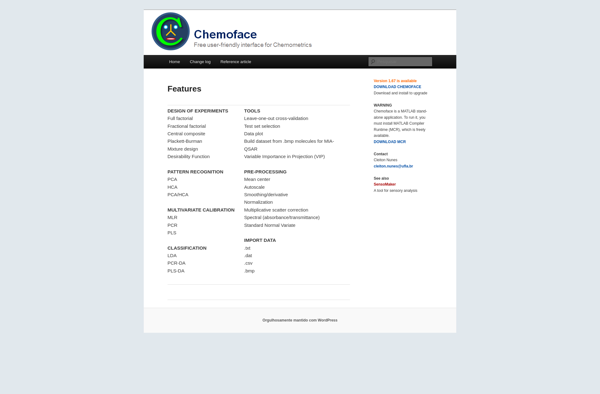
Chemoface is an open-source computer program for predicting the biological activities of chemical compounds. It utilizes machine learning models that have been trained on large datasets of chemicals and their associated bioassay data to predict potential therapeutic effects and safety risks.The key capabilities of Chemoface include:Predicting activity against a range...
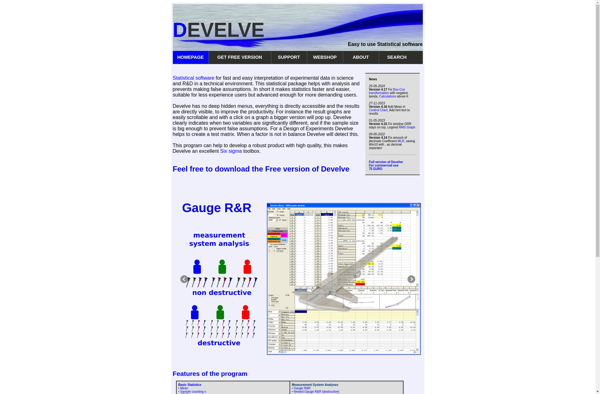
Develve is a flexible project management and bug tracking tool designed for agile software development teams. It provides a variety of features to plan, organize and track development projects, enabling seamless collaboration between team members.With Develve, you can:Manage user stories and tasks using kanban boardsTrack bugs and issues throughout the...