LabPlot is a free and open source software application for interactive graphing and analysis of scientific data. It provides functionality for organization and manipulation of data sets, 2D and 3D plotting as well as statistical analysis.
LabPlot is a free and open source software application for interactive graphing and analysis of scientific data. It provides functionality for organization and manipulation of data sets, 2D and 3D plotting as well as statistical analysis.
What is LabPlot?
LabPlot is a free, open source and cross-platform data visualization and analysis software aimed primarily at the education sector. It allows users to create 2D and 3D plots, analyze data statistically, fit functions to data points, manipulate data sets and organize them in a spreadsheet-like interface.
Some of the key features of LabPlot include:
A wide range of 2D and 3D plot types such as scatter plots, line plots, bar charts, histograms, pie charts, surface plots, contour plots etc.
Statistical analysis tools like averaging, standard deviation, linear and nonlinear curve fitting, correlation analysis etc.
Data organization in worksheets with functionality similar to spreadsheet software
Support for both tabular and matrix data structures
Import/export capabilities for popular data formats like CSV, HDF5, MATLAB, Excel etc.
Scripting interface for advanced data analysis tasks
High quality vector graphics output for publications
LabPlot simplifies repetitive tasks in collecting, organizing and analyzing data making it easy to transition from data to publication quality plots. Its flexibility, combined with the power and accessibility of Python scripting, makes LabPlot an attractive data visualization and analysis solution for students, teachers, scientists and engineers.
OriginPro is a powerful data analysis and graphing software designed for scientists, engineers, and analysts across various industries. It is developed by OriginLab Corporation for analyzing, graphing, and presenting scientific data.Some of the key features of OriginPro include:An extensive selection of analysis tools like peak analysis, surface fitting, statistics, signal...
MATLAB (matrix laboratory) is a multi-paradigm numerical computing environment and proprietary programming language developed by MathWorks. MATLAB allows matrix manipulations, plotting of functions and data, implementation of algorithms, creation of user interfaces, and interfacing with programs written in other languages.Some key features of MATLAB include:Matrix and array-oriented language for faster...
GnuPlot is a powerful, stable and free scientific graphing package with advanced capabilities. Developed originally for Unix-like operating systems, GnuPlot is now available for Windows, macOS and Linux.It can produce high-quality graphical visualizations of data from files or stdin, including simple x-y plots, histograms, contour plots, mesh plots, polar plots,...
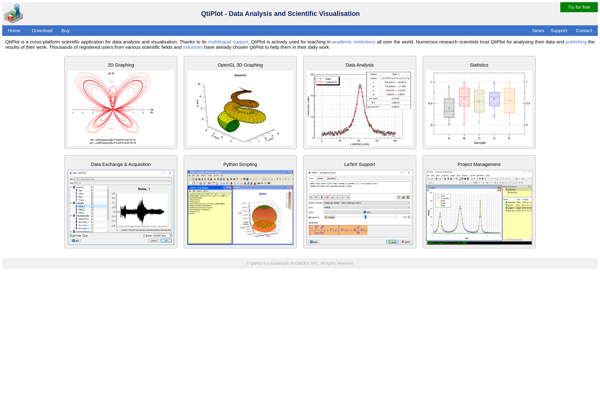
QtiPlot is an open-source data analysis and visualization application similar in scope and functionality to OriginLab's Origin software. Developed in C++ and utilizing the Qt framework, QtiPlot runs on Windows, MacOS, and Linux.QtiPlot provides a wide range of features for interactive scientific graphing and data analysis, including:2D and 3D plotting...
NumeRe is an open-source platform for numerical computing, data analysis, and scientific visualization. It provides a MATLAB-like environment and programming language focused on matrix operations, linear algebra routines, statistical analysis, and plotting. Some key features of NumeRe include:Fast vector/matrix math operations through integration of BLAS and LAPACK librariesA high-level scripting...
SciDaVis is a cross-platform computer program for numerical analysis and data visualization. It is designed to be compatible with OriginLab Origin software in terms of analysis capabilities and interface, while being free and open-source.Some key features of SciDaVis include:Interactive 2D and 3D plotting from imported dataA wide variety of 2D...
Matplotlib is a comprehensive 2D plotting library for Python that enables users to create a wide variety of publication-quality graphs, charts, and visualizations. It supports many basic and advanced plotting functionalities and integrates well with NumPy and Pandas data structures.Matplotlib can be used to visualize data in a variety of...