Veusz
Veusz: Open-source Scientific Plotting Software
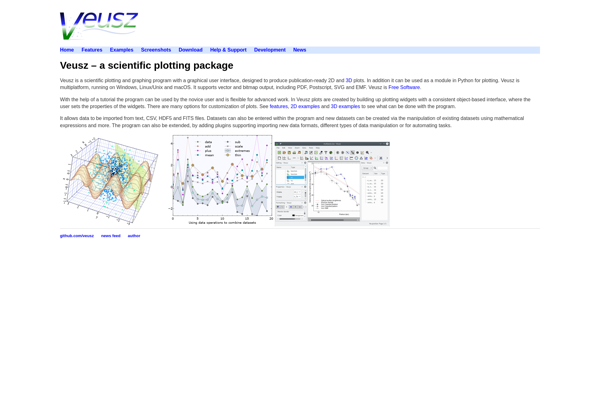
Veusz is an open-source scientific plotting and graphing software that allows users to generate 2D and 3D plots, histograms, contours, vector fields and more from data, with a cross-platform GUI for interactive plot generation.
What is Veusz?
Veusz is an open-source application designed for interactive plotting and graphing of scientific data. It can generate a wide variety of 2D and 3D plots including line plots, scatter plots, histograms, contour plots, vector fields, bar charts, maps and more.
Some key features of Veusz include:
- Intuitive graphical user interface for interactive plot construction
- Support for very large data sets
- High-quality output of publication-ready plots
- Extensive customization options for plot styles
- Import data from files, functions or other sources
- Cross-platform - works on Windows, Mac and Linux
- Scriptable using Python to automate workflows
- Export plots in variety of formats like PDF, PNG, SVG, etc.
- Large collection of customizable axes, grids, labels, etc.
- Powerful data transformation capabilities
Veusz excels at allowing users to quickly visualize scientific datasets through its interactive drag-and-drop interface. It does away with the need to script plotting code from scratch. The learning curve is small but Veusz packs a lot of power and flexibility underneath. With its broad format compatibility and top-notch output, Veusz is a compelling open-source alternative to proprietary graphing software for researchers, engineers and anyone who needs highly-refined publication-quality plots.
Veusz Features
Features
- Interactive GUI for plot generation
- 2D and 3D plotting
- Histograms
- Contours
- Vector fields
- Data analysis
- Export plots as images or PDFs
- Scriptable using Python
- Cross-platform (Windows, Linux, macOS)
Pricing
- Open Source
Pros
Cons
Official Links
Reviews & Ratings
Login to ReviewThe Best Veusz Alternatives
View all Veusz alternatives with detailed comparison →
Top Science & Engineering and Data Analysis & Visualization and other similar apps like Veusz
Here are some alternatives to Veusz:
Suggest an alternative ❐OriginPro

QtiPlot
NumeRe

SciDaVis

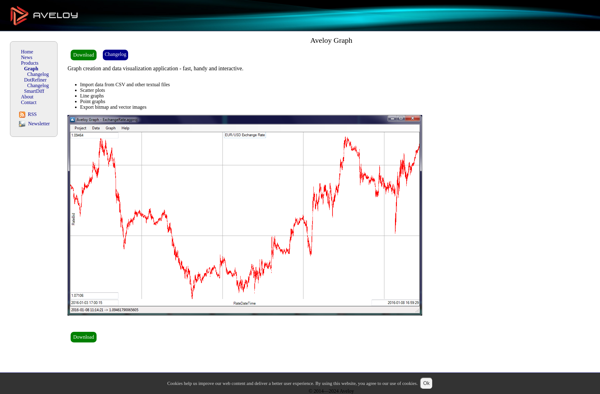
Aveloy Graph