SigmaPlot is a graphing and scientific data analysis software. It allows users to easily visualize data, perform statistical analysis, and produce high-quality graphs for publications and presentations.
SigmaPlot: Graphing and Scientific Data Analysis Software
SigmaPlot is a graphing and scientific data analysis software. It allows users to easily visualize data, perform statistical analysis, and produce high-quality graphs for publications and presentations.
What is SigmaPlot?
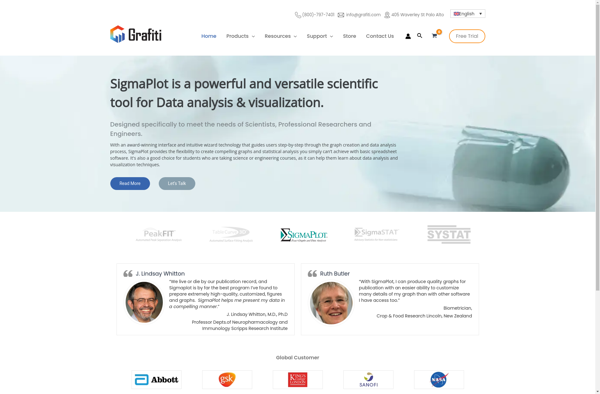
SigmaPlot is a comprehensive graphing and data analysis software designed for scientists and engineers across various industries. It enables users to easily visualize data, perform statistical analysis, and produce high-quality graphs and figures for publications, presentations, and reports.
Key features of SigmaPlot include:
Intuitive and customizable graphing interface to create 2D and 3D graphs such as line graphs, scatter plots, bar charts, pie charts, histograms, heat maps, contours, and surface plots
Extensive statistical analysis tools including hypothesis testing, ANOVA, regression analysis, time series analysis, and nonparametric tests
Automated graph and report generation capabilities
Publication-ready graphs with advanced customization options for colors, styles, annotations, legends, and multi-pane layouts
Support for a wide range of data formats from Excel, ASCII, databases, and instruments
Macros and automation through Visual Basic scripts
Available as both desktop and server-based solution to suit different deployment needs
With its flexibility, ease of use, and high-quality graphics capabilities, SigmaPlot enables scientists, engineers, and researchers to efficiently visualize data, identify trends and patterns, model data, and communicate results effectively through impactful graphs and reports.
OriginPro is a powerful data analysis and graphing software designed for scientists, engineers, and analysts across various industries. It is developed by OriginLab Corporation for analyzing, graphing, and presenting scientific data.Some of the key features of OriginPro include:An extensive selection of analysis tools like peak analysis, surface fitting, statistics, signal...
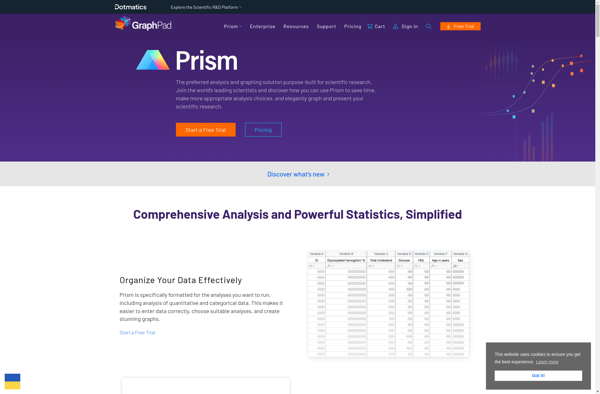
GraphPad Prism is a proprietary scientific 2D graphing and statistics software designed specifically for the needs of biomedical and scientific researchers. It provides an intuitive and user-friendly interface for analyzing, graphing, and presenting scientific data as high-quality and publication-ready figures.Key features of GraphPad Prism include:A wide range of 2D graph...
MATLAB (matrix laboratory) is a multi-paradigm numerical computing environment and proprietary programming language developed by MathWorks. MATLAB allows matrix manipulations, plotting of functions and data, implementation of algorithms, creation of user interfaces, and interfacing with programs written in other languages.Some key features of MATLAB include:Matrix and array-oriented language for faster...
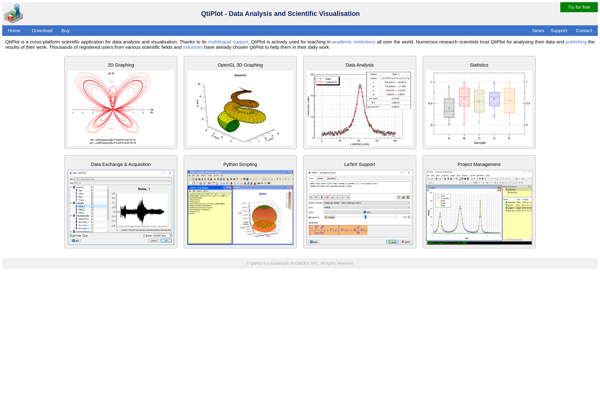
QtiPlot is an open-source data analysis and visualization application similar in scope and functionality to OriginLab's Origin software. Developed in C++ and utilizing the Qt framework, QtiPlot runs on Windows, MacOS, and Linux.QtiPlot provides a wide range of features for interactive scientific graphing and data analysis, including:2D and 3D plotting...
NumeRe is an open-source platform for numerical computing, data analysis, and scientific visualization. It provides a MATLAB-like environment and programming language focused on matrix operations, linear algebra routines, statistical analysis, and plotting. Some key features of NumeRe include:Fast vector/matrix math operations through integration of BLAS and LAPACK librariesA high-level scripting...
Mirai Math is a fully featured, open-source graphing calculator software for Windows, macOS, and Linux operating systems. Developed as an alternative to expensive proprietary math software like TI and Casio calculators, Mirai Math provides robust math capabilties in an easy-to-use interface.Key features of Mirai Math include:2D and 3D graphing for...
SymPy is an open-source Python library for symbolic mathematics. It enables users to manipulate mathematical expressions, solve equations, expand functions into series, calculate limits, take derivatives and integrals, work with matrices, plot graphs, and more.Some key features of SymPy include:Symbolic calculation engine that can perform arithmetic, algebra, calculus, discrete math,...
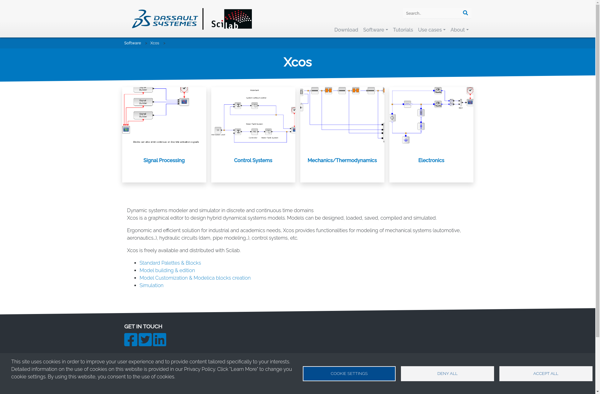
Xcos is an open-source software specialized in the simulation of dynamical systems, offering modeling and simulation features specifically oriented towards control systems. It is developed as a graphical user interface module for Scilab, the open source platform for numerical computation.Some key features of Xcos include:Block diagram model editor for building...
IGOR Pro is a powerful data analysis and visualization software application developed by WaveMetrics. It uses an object-oriented approach, allowing users to analyze and process data interactively through a drag-and-drop workflow interface.Some key features of IGOR Pro include:Interactive 2D and 3D scientific graphing and publication-quality plottingA wide range of analysis...
Doronix Math Toolbox is a free, open-source math software program designed primarily for students and teachers. It includes a wide range of mathematical tools and utilities in a single interface, making it an versatile option for daily math needs.Key features of Doronix Math Toolbox include:Graphing Calculator - Plot and analyze...