GraphPad Prism

GraphPad Prism

GraphPad Prism is proprietary scientific 2D graphing and statistics software for researchers. It is used for analyzing and graphing scientific data, performing statistical tests, and designing figures for publications.
GraphPad Prism image
data-visualization statistics regression curve-fitting scientific-graphs

GraphPad Prism: Proprietary Scientific Graphing Software

Proprietary scientific 2D graphing and statistics software for researchers, used for data analysis, statistical tests, and publication-ready figures.

What is GraphPad Prism?

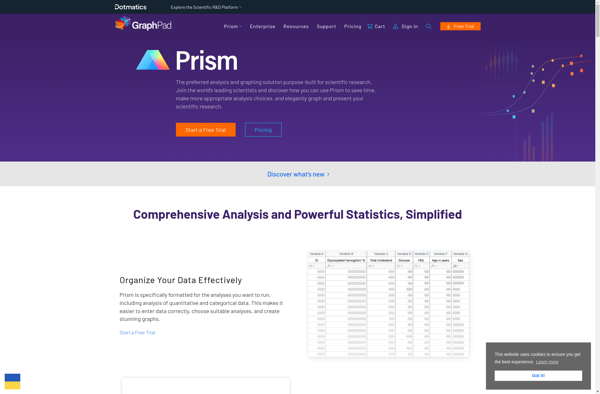
GraphPad Prism is a proprietary scientific 2D graphing and statistics software designed specifically for the needs of biomedical and scientific researchers. It provides an intuitive and user-friendly interface for analyzing, graphing, and presenting scientific data as high-quality and publication-ready figures.

Key features of GraphPad Prism include:

  • A wide range of 2D graph types such as scatter plots, line graphs, bar graphs, pie charts, histograms, and more
  • In-depth statistical analyses including t-tests, ANOVA, regression, and nonparametric tests
  • Advanced curve fitting for enzymology, pharmacology, and ligand binding studies
  • Automated layout and formatting for creating multi-panel figures
  • Export publication-quality vector and raster image formats
  • Comprehensive support for working with large datasets
  • An easy learning curve for beginners while still meeting the advanced needs of power users

GraphPad Prism aims to accelerate researchers' workflow by eliminating the need to export data to multiple platforms for graphing, analysis, and figure preparation. Its balance of power, flexibility, and ease-of-use has made it a leading choice among scientists and research organizations worldwide for analyzing and presenting scientific results.

GraphPad Prism Features

Features

  1. 2D graphing
  2. Curve fitting
  3. Statistical analysis
  4. Scientific data analysis
  5. Customizable graphs and figures
  6. Intuitive interface
  7. Automation and batch processing
  8. Data organization and management
  9. Publication-quality figures
  10. Integration with Microsoft Office

Pricing

  • One-time Purchase
  • Subscription-Based

Pros

Powerful graphing and analysis capabilities

User-friendly and intuitive interface

Comprehensive statistical tests

Automates repetitive tasks

Creates high-quality graphs and figures

Saves time compared to coding graphs manually

Good technical support

Cons

Expensive license cost

Proprietary software

Limited to 2D graphing

Steep learning curve for advanced features

No open source or community development


The Best GraphPad Prism Alternatives

Top Science & Education and Data Analysis and other similar apps like GraphPad Prism


R (programming language) icon

R (programming language)

R is an open-source programming language and free software environment for statistical computing, bioinformatics, graphics, data science, and general-purpose programming. The R language provides a wide variety of statistical analysis techniques and graphical capabilities which make it a popular choice for data analysis and visualization.Some key features of R include:Open-source...
R (programming language) image
OriginPro icon

OriginPro

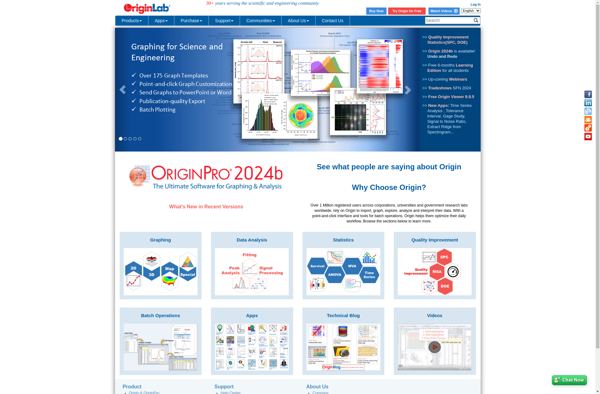
OriginPro is a powerful data analysis and graphing software designed for scientists, engineers, and analysts across various industries. It is developed by OriginLab Corporation for analyzing, graphing, and presenting scientific data.Some of the key features of OriginPro include:An extensive selection of analysis tools like peak analysis, surface fitting, statistics, signal...
OriginPro image
SigmaPlot icon

SigmaPlot

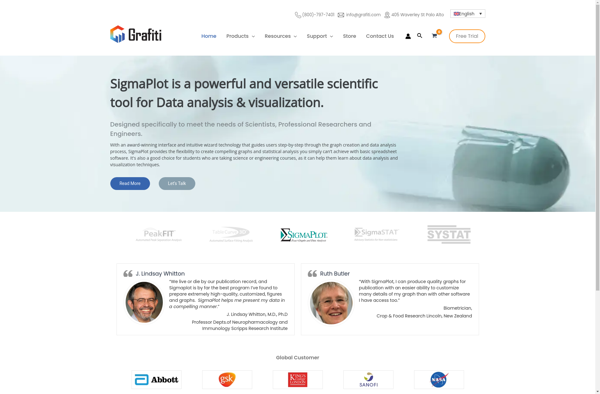
SigmaPlot is a comprehensive graphing and data analysis software designed for scientists and engineers across various industries. It enables users to easily visualize data, perform statistical analysis, and produce high-quality graphs and figures for publications, presentations, and reports.Key features of SigmaPlot include:Intuitive and customizable graphing interface to create 2D and...
SigmaPlot image
XLSTAT icon

XLSTAT

XLSTAT is a comprehensive, user-friendly statistical analysis add-in for Microsoft Excel and Google Sheets. It allows users to perform over 200 statistical features directly within Excel for data science and data analytics. XLSTAT provides a wide range of descriptive statistics, hypothesis testing, regression analysis, ANOVA, machine learning, principal component analysis,...
XLSTAT image
SOFA Statistics icon

SOFA Statistics

SOFA Statistics is a user-friendly, open-source statistics, analysis, and reporting tool that runs as a desktop application on Windows, Mac, and Linux. It provides an extensive range of statistical methods and visualization tools for exploratory data analysis, data cleaning, model fitting, results reporting, and dashboard creation.Some key features of SOFA...
SOFA Statistics image
Pathomx icon

Pathomx

Pathomx is an open-source software tool designed specifically for the interactive visualization and analysis of metabolomics data, although it also supports other omics data types like transcriptomics. It provides a user-friendly graphical interface that allows researchers to rapidly interrogate their data, identify trends and patterns, perform statistical analyses, and generate...