WebPlotDigitizer
WebPlotDigitizer: Open-Source Web-Based Tool for Extracting Data from Visuals
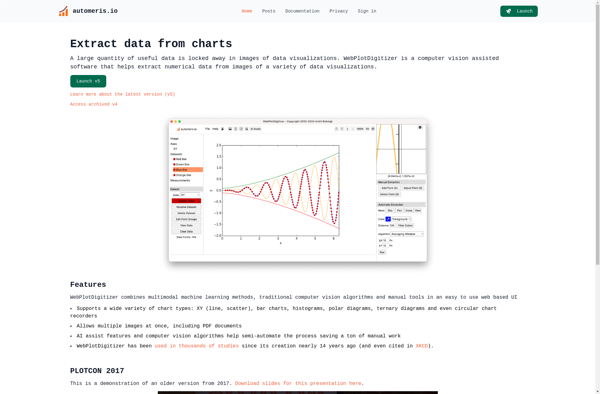
Extract quantitative data from plots, images, and maps with automatic axis, grid, and data point detection.
What is WebPlotDigitizer?
WebPlotDigitizer is an open-source, web-based application designed to extract numerical data from line plots, bar graphs, maps, scatter plots, and other visual representations of data. It was created to facilitate the digitalization process of turning images containing plots, graphs, and maps into actual data that can be used for analysis.
Some key features of WebPlotDigitizer include:
- Automatic detection of axes, grid lines, data points, bar edges, etc to minimize required user input
- Flexible axis calibration systems for both linear and nonlinear axes
- Support for extracting data from specialized plot types like polar plots, ternary plots, wind charts, etc.
- Dataset editing and exporting capabilities
- Cross-browser compatibility
- Offline capabilities for increased accessibility and privacy
The software runs entirely client-side in the web browser, so no data is sent to any servers. This makes it easy to use for extracting sensitive data. It works by letting users calibrate the axes and data points on a visual representation, mapping the image coordinates to real-world data values. The calibration information is then used to extract datasets automatically.
WebPlotDigitizer is useful for researchers, scientists, engineers, and anyone who needs to get quantitative data out of charts, graphs, plots, maps, and other images. It can save significant time compared to manual data extraction methods.
WebPlotDigitizer Features
Features
- Extracts data from images, plots, maps, etc
- Automatic detection of axes, grids, data points
- Supports a wide variety of plot types like line, bar, scatter, polar, ternary plots, etc
- Can handle skewed/irregular plots
- Extracts data into CSV/Excel files
- Calibration tools to scale axes
- Image processing tools
Pricing
- Open Source
Pros
Cons
Official Links
Reviews & Ratings
Login to ReviewThe Best WebPlotDigitizer Alternatives
View all WebPlotDigitizer alternatives with detailed comparison →
Top Science & Education and Data Extraction and other similar apps like WebPlotDigitizer
Here are some alternatives to WebPlotDigitizer:
Suggest an alternative ❐GraphClick
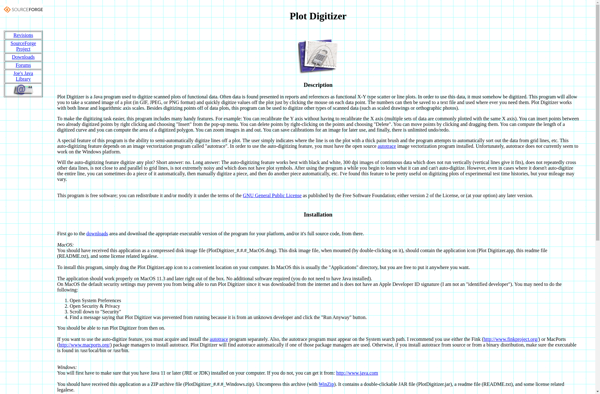
Plot Digitizer
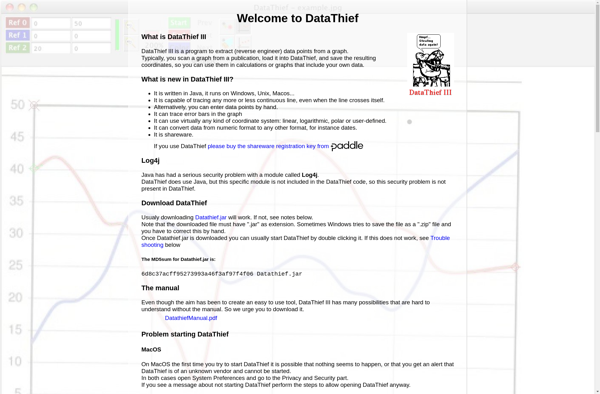
DataThief III
DigitizeIt

JTechDig
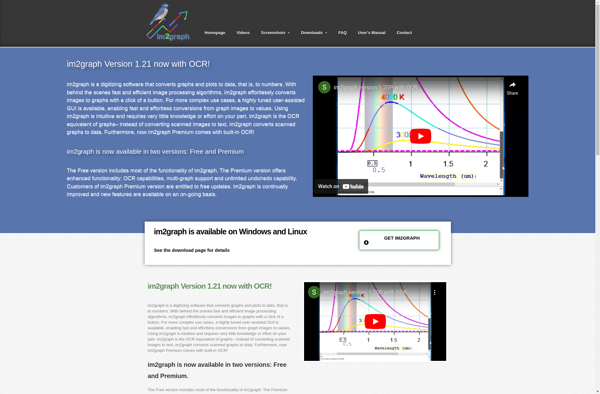
Im2graph
UN-SCAN-IT

Engauge Digitizer
Didger
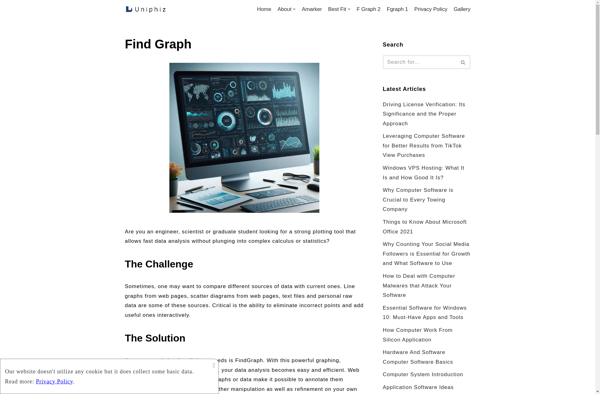
Find Graph