GraphClick

GraphClick: Free Interactive Graph Software
GraphClick is a free, open-source software for creating interactive graphs, charts, and data visualizations. It allows users to easily upload datasets, customize visual styles, and add interactivity to create engaging data stories.
What is GraphClick?
GraphClick is a free, open-source data visualization software that allows anyone to create compelling, interactive data visualizations and graphs without coding. It has an intuitive drag-and-drop interface that makes it easy for non-technical users to upload their own datasets, choose from a variety of graph and chart types like bar charts, line charts, scatter plots, maps, and more, and customize the look and feel of their visualizations.
Some key features of GraphClick include:
- Import CSV/Excel files for analysis
- Drag-and-drop interface for building visualizations
- Library of customizable chart/graph templates
- Visual customization tools for changing colors, fonts, layouts and more
- Annotations and highlighting tools
- Collaboration tools to share and edit projects
- Exporting/embedding options for presentations and websites
- 100% free and open-source
With its user-friendly interface requiring no coding knowledge, customization capabilities, and sharing options, GraphClick makes it possible for anyone working with data to create engaging, interactive data stories and easily share insights. It's a great alternative to proprietary data viz tools for companies, non-profits, academics, students, journalists, governments, and more.
GraphClick Features
Features
- Upload and visualize data
- Customizable graph and chart types
- Interactive data exploration
- Annotations and highlighting
- Export images and PDFs
- Embeddable graphs and charts
- Open source and free
Pricing
- Free
- Open Source
Pros
Cons
Official Links
Reviews & Ratings
Login to ReviewThe Best GraphClick Alternatives
View all GraphClick alternatives with detailed comparison →
Top Data Visualization and Interactive Data Visualization and other similar apps like GraphClick
Here are some alternatives to GraphClick:
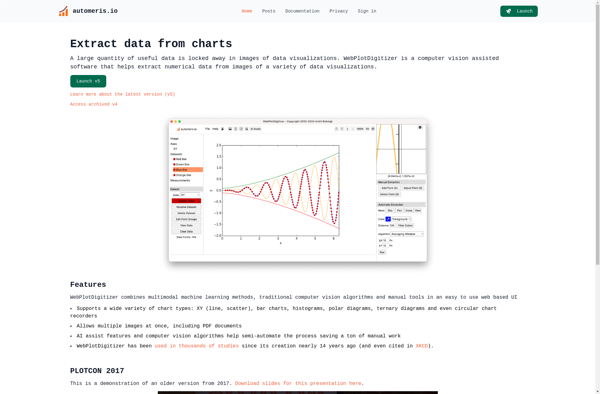
Suggest an alternative ❐WebPlotDigitizer
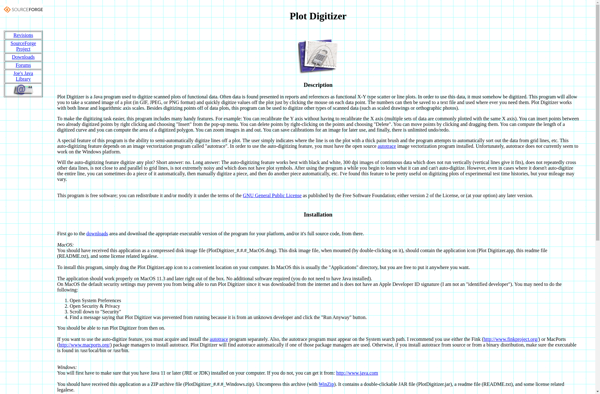
Plot Digitizer
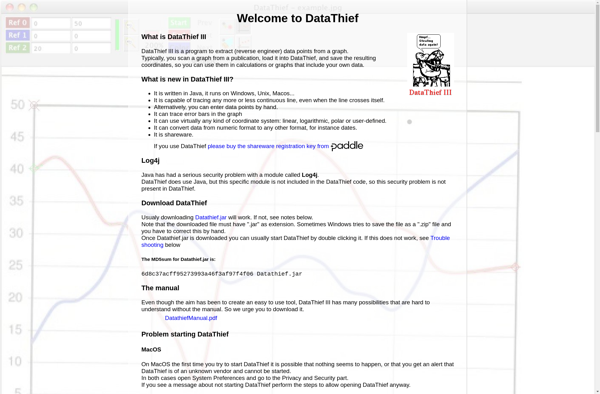
DataThief III
DigitizeIt

JTechDig
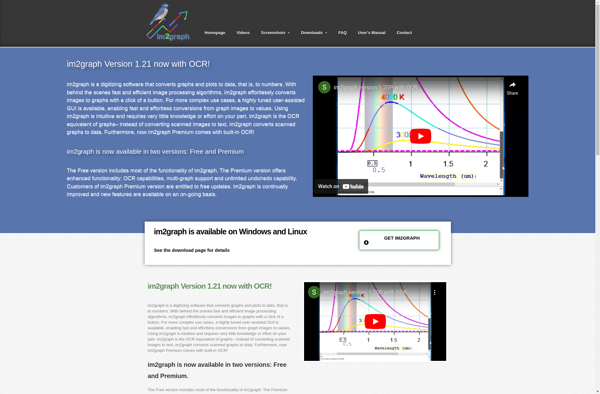
Im2graph
UN-SCAN-IT

Engauge Digitizer

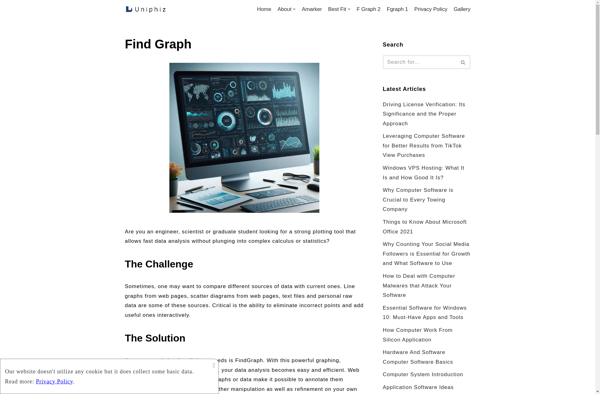
Find Graph