XLSTAT

XLSTAT: Statistical Software for Data Analysiss
A powerful tool for data analysis, including data mining, statistical modeling, and data visualization, with over 200 features and an easy-to-use interface.
What is XLSTAT?
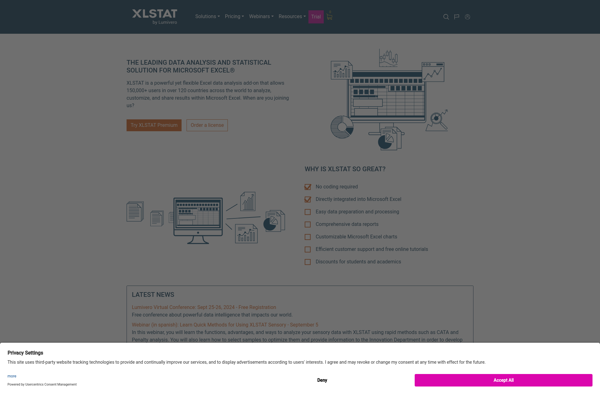
XLSTAT is a comprehensive, user-friendly statistical analysis add-in for Microsoft Excel and Google Sheets. It allows users to perform over 200 statistical features directly within Excel for data science and data analytics. XLSTAT provides a wide range of descriptive statistics, hypothesis testing, regression analysis, ANOVA, machine learning, principal component analysis, clustering, forecasting and more.
Some key features and benefits of XLSTAT include:
- Streamlined workflow - XLSTAT integrates seamlessly with Excel so you can analyze data directly within the spreadsheets you already use
- Powerful analytics - conduct everything from simple descriptive stats to advanced multivariate analysis including hypothesis tests, correlation analysis, regression modeling, principal component analysis, clustering, and more
- Flexible visualization - easily create professional charts and graphs without needing to export data to third-party tools
- Ease of use - an intuitive interface allows both statistics novices and experts to quickly apply analytical techniques to their data with a shallow learning curve
- Reporting - capabilities to share findings through custom, presentation-ready reports
- Time savings - allows analysts to maximize efficiency by eliminating exporting data to other platforms for modeling and visualization
- Trusted reliability - XLSTAT has been in active development for over 20 years as a leading statistical add-in for Excel and Google Sheets
With its user-friendly interface, depth of analytical features and tight integration with Excel, XLSTAT is an ideal statistical software tool for analysts or data scientists across virtually any industry.
XLSTAT Features
Features
- Statistical analysis
- Machine learning
- Data mining
- Data visualization
- Big data analytics
- Text mining
- Forecasting
- Simulation
Pricing
- Subscription-Based
Pros
Cons
Official Links
Reviews & Ratings
Login to ReviewThe Best XLSTAT Alternatives
Top Office & Productivity and Spreadsheets and other similar apps like XLSTAT
Here are some alternatives to XLSTAT:
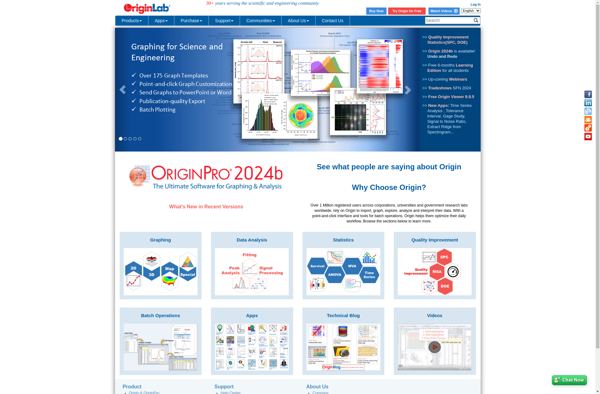
Suggest an alternative ❐OriginPro

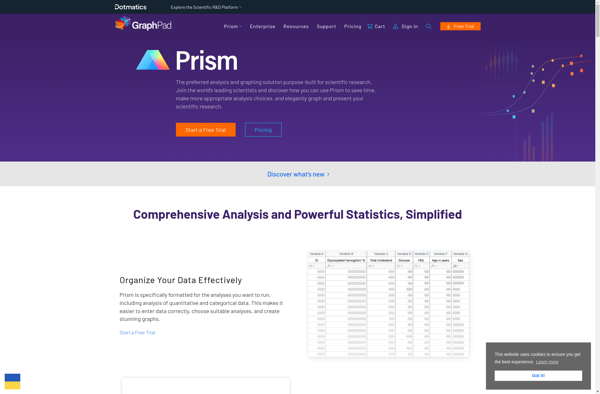
GraphPad Prism

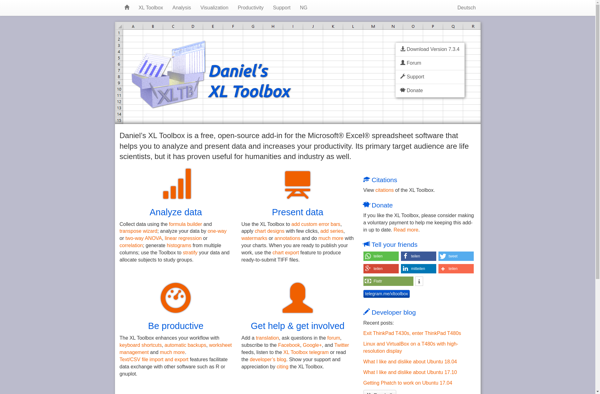
Daniel’s XL Toolbox
