DataMelt is an open-source data analysis and visualization platform. It allows importing, cleaning, transforming, analyzing, visualizing and publishing scientific data with an intuitive graphical workflow editor interface.
An open-source data analysis and visualization platform for importing, cleaning, transforming, analyzing, visualizing and publishing scientific data with an intuitive graphical workflow editor interface.
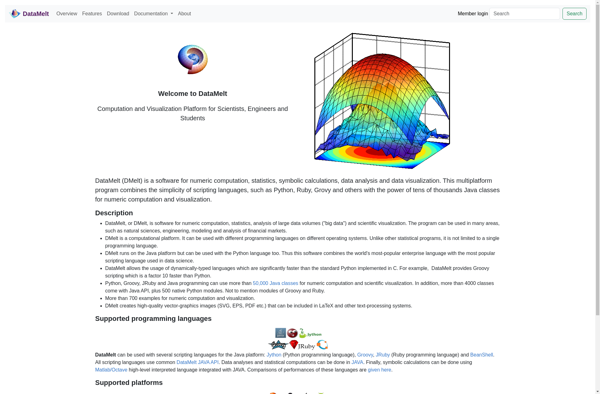
What is DataMelt?
DataMelt is an open-source data analysis and visualization application aimed at scientists, engineers and students. It allows importing, cleaning, transforming, analyzing, visualizing and publishing scientific data with an intuitive graphical workflow editor interface.
Some of its key features include:
Import data from various sources like CSV, Excel, databases, APIs, etc.
Clean, filter, merge, transform, analyze and visualize data
Large collection of built-in analysis and visualization modules
Create complex analysis workflows visually without writing code
Extend functionality with Python, R, Octave and Java scripts
Publish results as interactive web pages or PDF reports
DataMelt runs on Windows, Linux and Mac systems. It can connect to data sources like MySQL, PostgreSQL, MongoDB, Redis and others. The intuitive workflow editor interface allows building analysis pipelines by dragging and dropping modules, without needing to know programming.
DataMelt is useful for scientists, engineers, analysts and students looking for an open-source data analysis and visualization tool with advanced capabilities but easy enough interface for non-programmers. It combines power and accessibility in a single package.
DataMelt Features
Features
Graphical workflow editor interface
Import, clean, transform, analyze, visualize and publish scientific data
OriginPro is a powerful data analysis and graphing software designed for scientists, engineers, and analysts across various industries. It is developed by OriginLab Corporation for analyzing, graphing, and presenting scientific data.Some of the key features of OriginPro include:An extensive selection of analysis tools like peak analysis, surface fitting, statistics, signal...
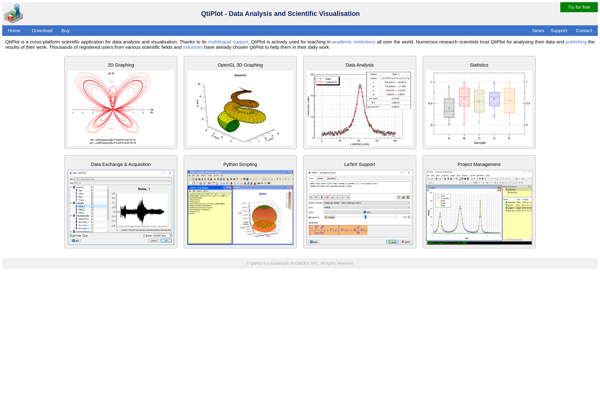
QtiPlot is an open-source data analysis and visualization application similar in scope and functionality to OriginLab's Origin software. Developed in C++ and utilizing the Qt framework, QtiPlot runs on Windows, MacOS, and Linux.QtiPlot provides a wide range of features for interactive scientific graphing and data analysis, including:2D and 3D plotting...
NumeRe is an open-source platform for numerical computing, data analysis, and scientific visualization. It provides a MATLAB-like environment and programming language focused on matrix operations, linear algebra routines, statistical analysis, and plotting. Some key features of NumeRe include:Fast vector/matrix math operations through integration of BLAS and LAPACK librariesA high-level scripting...
SciDaVis is a cross-platform computer program for numerical analysis and data visualization. It is designed to be compatible with OriginLab Origin software in terms of analysis capabilities and interface, while being free and open-source.Some key features of SciDaVis include:Interactive 2D and 3D plotting from imported dataA wide variety of 2D...
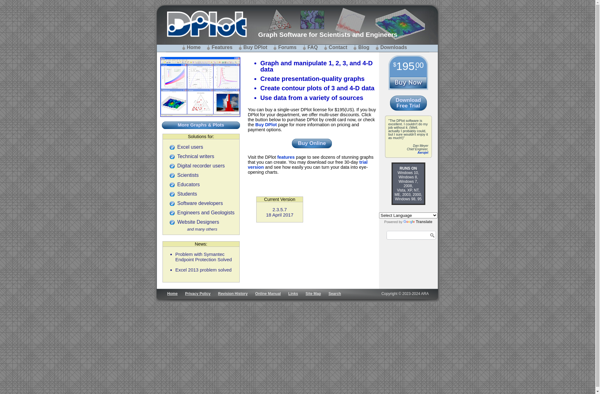
DPlot is an open-source, cross-platform application designed for interactive scientific data visualization and analysis. It features a user-friendly graphical interface that allows users to easily create 2D and 3D plots, fit data to both linear and non-linear models, perform statistical analysis, and customize graph attributes.Some key features of DPlot include:Support...
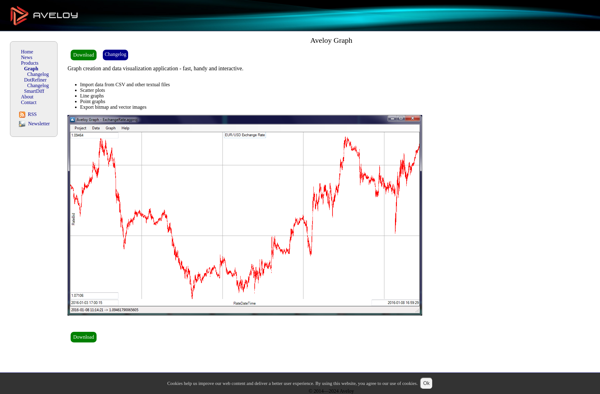
Aveloy Graph is a no-code business intelligence analytics and visualization software for building interactive dashboards. It provides an intuitive way for users of all skill levels to visualize data and create shareable analytics.With Aveloy Graph, users can connect data from multiple sources including MySQL, PostgreSQL, MongoDB, Excel, CSV files, and...
jHepWork is an open-source data analysis framework written in Java that focuses on interactive data analysis and visualization of scientific data. It is developed by the University of Belgrade and CERN.Some key features of jHepWork include:An integrated Python interpreter that allows combining Java and Python code.A workflow system that enables...