JHepWork
jHepWork: Open-Source Data Analysis Frameworks
jHepWork is an open-source data analysis framework written in Java that focuses on interactive data analysis and visualization. It offers a workflow system with parallel computing to process large datasets.
What is JHepWork?
jHepWork is an open-source data analysis framework written in Java that focuses on interactive data analysis and visualization of scientific data. It is developed by the University of Belgrade and CERN.
Some key features of jHepWork include:
- An integrated Python interpreter that allows combining Java and Python code.
- A workflow system that enables creating analysis sequences and run them locally or distribute over clusters/clouds using parallel computing.
- Out-of-the-box modules for histograms, fitting, mathematics, statistics, neural networks, importing/exporting various data formats, and more.
- Interactive data visualization based on ROOT and JavaScript libraries like D3. Data can be visualized as histograms, graphs, and tables.
- Built-in parallel computing and cluster/GRID computing support for processing large datasets.
- Plugin architecture to extend functionality using Java or Python.
jHepWork aims to provide scientists a quick way to analyze and visualize data without spending time on coding. The workflow system makes it amenable to interactive analysis as well as automation. Being Java-based, it is cross-platform and integrates well with JVM languages.
JHepWork Features
Features
- Interactive data analysis and visualization
- Workflow system for processing large datasets
- Parallel computing capabilities
- Plugin architecture to extend functionality
- Scripting support for automation
- Data import/export for many formats
Pricing
- Open Source
Pros
Cons
Official Links
Reviews & Ratings
Login to ReviewThe Best JHepWork Alternatives
View all jHepWork alternatives with detailed comparison →
Top Science & Engineering and Data Analysis and other similar apps like JHepWork
Here are some alternatives to JHepWork:
Suggest an alternative ❐OriginPro

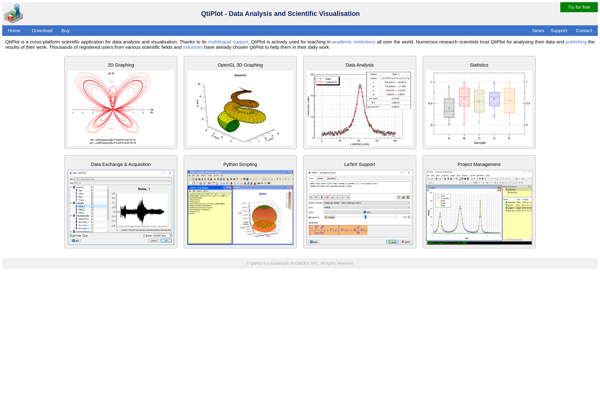
QtiPlot
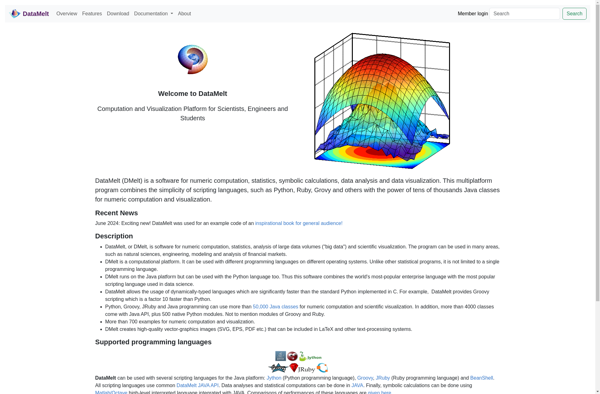
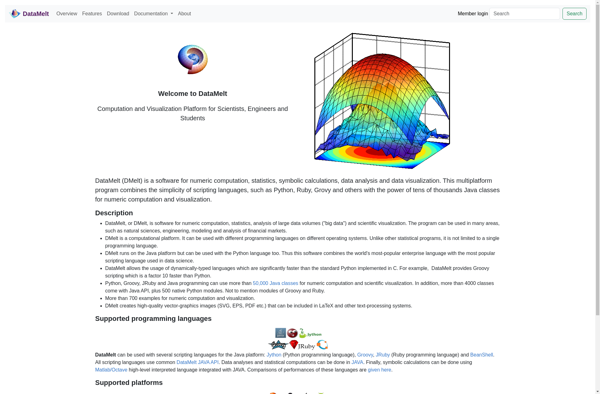
DataMelt
SciDaVis

DPlot
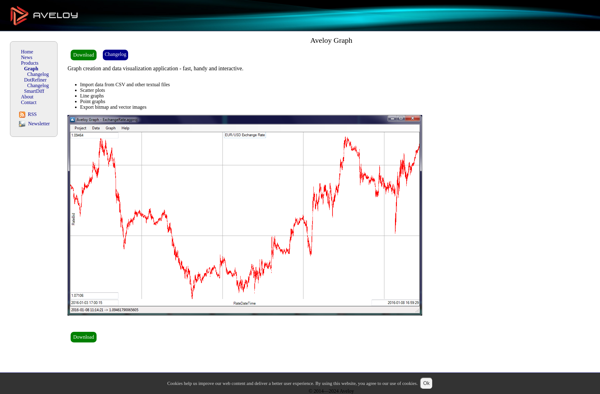
Aveloy Graph