JFreeChart is a free, open-source Java chart library that allows developers to display professional quality charts in their applications. It supports a wide range of chart types including pie charts, bar charts, line charts, scatter plots, and more.
JFreeChart is a free, open-source Java chart library that allows developers to display professional quality charts in their applications. It supports a wide range of chart types including pie charts, bar charts, line charts, scatter plots, and more.
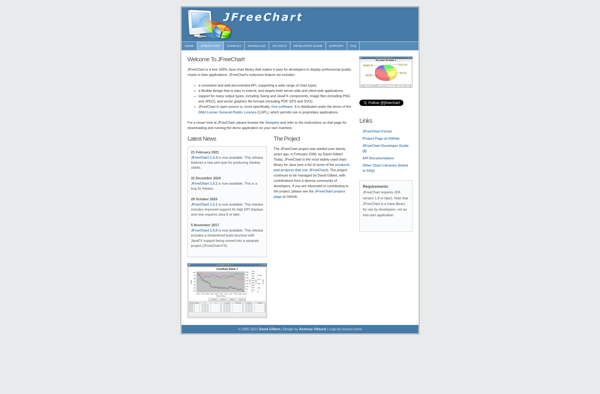
What is JFreeChart?
JFreeChart is a feature-rich, free Java chart library that enables developers to add impressive charts and graphs to their Java applications. Originally created by David Gilbert in 2000, JFreeChart has grown to become one of the most widely used Java charting solutions.
Some key capabilities and benefits of JFreeChart include:
Open-source library distributed under LGPL license
Supports a wide variety of chart types: pie charts, bar charts, line charts, XY plots, time series charts, Gantt charts, scatter plots, and more
Extensive customization options - control colors, fonts, legends, axes, etc
Flexible design that can be used for both server-side and client-side chart generation
Integrates well with other Java libraries and web frameworks like Spring and JSF
Includes advanced features like interactive charts, animated Zoom/Pan, annotations and more
Backed by a large community of developers and users
Companies from various industries use JFreeChart to add visually appealing, interactive charts and graphs to web dashboards, PDF reports, Swing applications and more. With its flexible API and comprehensive features, JFreeChart reduces the effort required for chart implementation in Java projects.
JFreeChart Features
Features
Wide range of 2D chart types including bar charts, pie charts, line charts, scatter plots, etc
Extensive customization options for colors, fonts, legends, axes, etc
Supports interactive charts with zooming, panning, mouseover effects
Can export charts as images or PDF documents
Includes domain-specific extensions like statistical charts, financial charts, Gantt charts, etc
Supports large datasets with fast rendering
Compatible with major Java GUI frameworks like Swing and JavaFX
GnuPlot is a powerful, stable and free scientific graphing package with advanced capabilities. Developed originally for Unix-like operating systems, GnuPlot is now available for Windows, macOS and Linux.It can produce high-quality graphical visualizations of data from files or stdin, including simple x-y plots, histograms, contour plots, mesh plots, polar plots,...
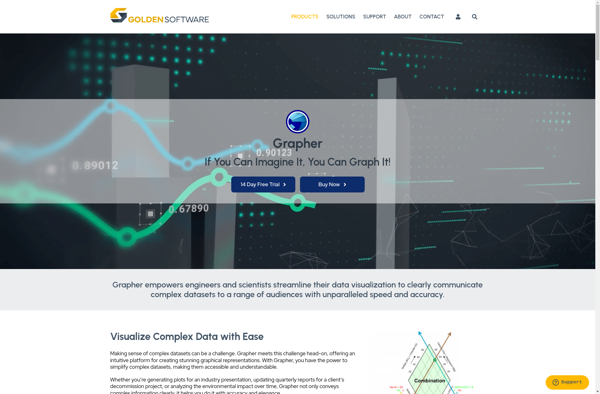
Golden Software Grapher is a powerful 2D and 3D scientific data visualization application. It enables users to create a wide variety of graphs and charts to represent complex data sets, including specialized plots like contour, vector, watershed, pie, bar, scatter, polar, ternary, statistical graphs and many more.Grapher excels at handling...
Graphmatica is a powerful, user-friendly software application for visualizing and analyzing complex network graphs. Developed by an international team of researchers and programmers, Graphmatica is offered completely free of charge under an open-source license.With an intuitive graphical interface, Graphmatica makes it easy to import network data from standard file formats...
Matplotlib is a comprehensive 2D plotting library for Python that enables users to create a wide variety of publication-quality graphs, charts, and visualizations. It supports many basic and advanced plotting functionalities and integrates well with NumPy and Pandas data structures.Matplotlib can be used to visualize data in a variety of...
IGOR Pro is a powerful data analysis and visualization software application developed by WaveMetrics. It uses an object-oriented approach, allowing users to analyze and process data interactively through a drag-and-drop workflow interface.Some key features of IGOR Pro include:Interactive 2D and 3D scientific graphing and publication-quality plottingA wide range of analysis...
Autograph is software designed specifically for applying digital signatures to documents. It allows individuals and teams to sign PDFs, Word documents, and other file types electronically.Some key features of Autograph include:Intuitive drag-and-drop interface for adding signatures to PDFsRole-based signing workflows with sequential or parallel routing optionsBulk sending of documents for...
Dash Reports is a business intelligence and data visualization software used by organizations to connect to data sources like databases, cloud apps, and files, and build interactive reports and dashboards that provide actionable insights. Some key features of Dash Reports include:Intuitive drag-and-drop interface that makes it easy for non-technical users...