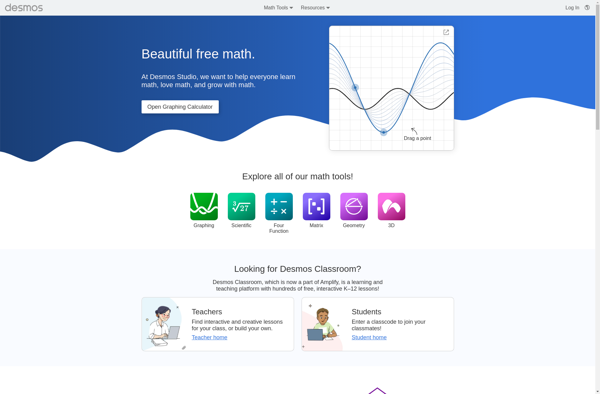
Desmos is an online graphing calculator that allows users to plot mathematical functions, equations, inequalities, parametric equations, polar equations, scatter plots, and regression lines. It has an intuitive, easy-to-use interface and supports mathematical expressions formatte
Desmos: Online Graphing Calculator for Math Functions
Desmos is an online graphing calculator that allows users to plot mathematical functions, equations, inequalities, parametric equations, polar equations, scatter plots, and regression lines. It has an intuitive, easy-to-use interface and supports mathematical expressions formatted in standard and LaTeX notation.
What is Desmos?
Desmos is an online graphing calculator and geometry tool used by students, teachers, and professionals in math, science, engineering, business, and more. It allows users to quickly visualize mathematical functions, equations, inequalities, and data sets with an easy-to-use web interface and mobile apps for iOS and Android.
Key features of Desmos include:
Interactive graphing for mathematical functions, equations, inequalities, polar equations, parametric equations, scatter plots, regression lines, and more
Geometry tools for constructing lines, shapes, transformations, vectors, and measuring angles and distances
Matrix and list support for visualizing data sets
Intuitive organization, labeling, and annotation tools
LaTeX and text equation support
Extensive math expression parsing capabilities
Collaboration tools for sharing graphs
Programming platform and publisher for creating interactive online activities
Free to use for students, teachers, and other independent users
Desmos draws on web technology and thoughtful UX design to create an engaging platform for mathematical and STEM exploration. Since it runs in the browser, it works seamlessly across devices from Chromebooks to iPads to phones. It has become an essential tool for classrooms and homes looking to engage students and bring math to life.
Desmos Features
Features
Online graphing calculator
Supports various types of graphs and plots
Intuitive and easy-to-use interface
Supports math expressions in standard and LaTeX notation
Collaboration tools
Classroom activities and pre-made lessons
Geometry tools
Scientific calculator
Mobile apps
Pricing
Freemium
Pros
Free to use
Easy to get started
Great for visualizing math concepts
Useful classroom tool
Promotes math collaboration
Cons
Limited customization options
Not as full-featured as desktop graphing calculators
GeoGebra is a free, open-source dynamic mathematics software that can be used for teaching and learning mathematics at all levels of education. It combines geometry, algebra, spreadsheets, graphing, statistics and calculus in one easy-to-use and well-integrated package making it an excellent tool for demonstrating mathematical concepts.Some of the key features...
GnuPlot is a powerful, stable and free scientific graphing package with advanced capabilities. Developed originally for Unix-like operating systems, GnuPlot is now available for Windows, macOS and Linux.It can produce high-quality graphical visualizations of data from files or stdin, including simple x-y plots, histograms, contour plots, mesh plots, polar plots,...
Plotly is an open-source graphing library that allows users to create interactive, publication-quality graphs, charts, and dashboards. It supports Python, R, JavaScript, and Excel as programming languages. Some key features of Plotly include:Interactive visualization - Plotly charts are interactive with features like hover text, zooming, panning, selectable legends, and editable...
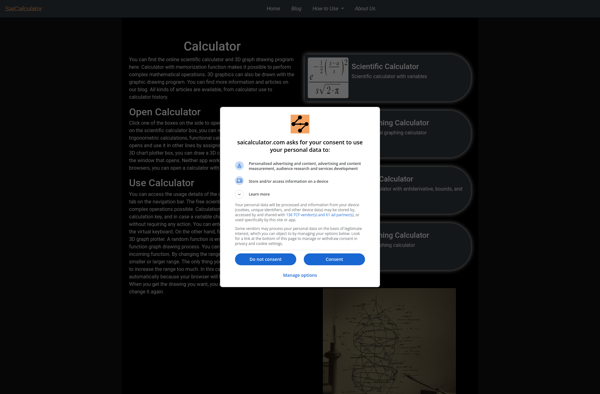
SaiCalculator is a free calculator app designed specifically for mobile devices. With its clean and intuitive interface, it aims to provide an enjoyable calculation experience for casual and power users alike.At its core, SaiCalculator offers all the basic arithmetic functions you would expect - addition, subtraction, multiplication, division - while...
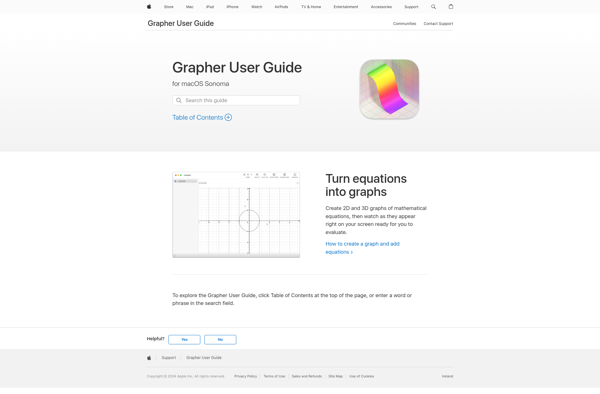
Grapher is a powerful 2D and 3D graphing utility developed by Apple Inc. and included with macOS. It allows users to visualize a wide variety of data sets, equations, geometric shapes, scalar/vector fields in 2D and 3D, and more. Some key features of Grapher include:Intuitive interface for entering equations and...
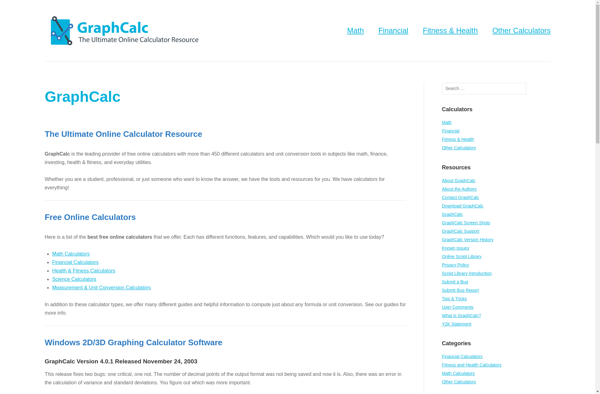
GraphCalc is a feature-rich graphical calculator software application aimed primarily at high school and college students studying math and science. It allows users to easily plot a wide variety of 2D and 3D functions and visualize them interactively in order to gain deeper mathematical understanding.Key features of GraphCalc include:Intuitive graphical...
Bokeh is an open-source Python library for creating interactive data visualizations for modern web browsers. It allows users to quickly construct versatile and high-performance graphics from simple plots to complex dashboards. Some key features of Bokeh include:Integration with common Python data science libraries like NumPy, Pandas, Scikit-Learn for easy data...
fxSolver is a free online math calculator and equation solver. It allows users to easily solve a wide range of math problems and calculate formulas without needing to install any software.Some key features of fxSolver include:Supports various common math functions like trigonometry, logarithms, fractions, matrices, etc.Can solve equations and formulas...
Graph.tk is a powerful yet easy-to-use online diagram and graph creation suite that enables users to visually map out concepts, ideas, workflows, organizational charts, network topologies, and more. With an intuitive drag-and-drop interface and a comprehensive library of templates, shapes, and icons, Graph.tk makes it simple for anyone to create...