Pygal
Pygal: Python Charting Library
Pygal is a Python charting library that allows you to generate SVG charts from data. Some key features include support for various chart types like bar charts, pie charts, line charts etc., customizable styles and themes, and integration with major Python web frameworks.
What is Pygal?
Pygal is an open-source Python charting library that provides tools to build interactive SVG charts and graphs from data. Some of the key features and capabilities of Pygal include:
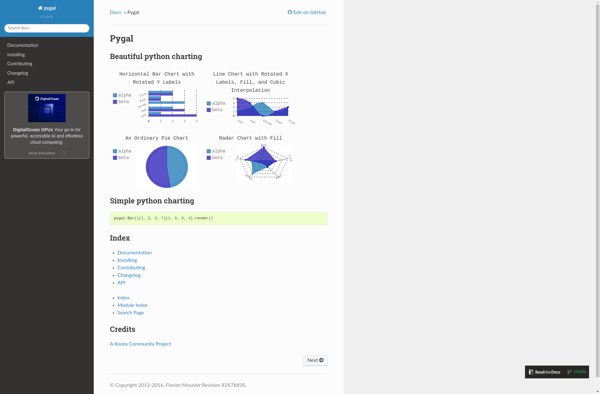
- Support for various common chart types including bar charts, pie charts, line charts, xy charts, radar charts, box plots, dot plots etc.
- Highly customizable - colors, styles, themes, legend, tooltips and more can be customized
- Responsive SVG output that works well on all modern browsers and devices
- Integration with major Python web frameworks like Django and Flask
- Support for large and streaming datasets
- Client-side interactivity powered by SVG features
- Extensible architecture to create custom chart types
- Ability to export charts as PNG images
Overall, Pygal stands out as a lightweight yet powerful data visualization library for Python developers. With its wide array of chart types, customization options and framework integrations, Pygal makes it easy to add interactive and modern-looking charts and graphs to Python web applications.
Pygal Features
Features
- Generates SVG charts from data
- Supports various chart types like bar, pie, line, etc
- Customizable styles and themes
- Integration with major Python web frameworks
Pricing
- Open Source
Pros
Cons
Official Links
Reviews & Ratings
Login to ReviewThe Best Pygal Alternatives
View all Pygal alternatives with detailed comparison →
Top Development and Data Visualization and other similar apps like Pygal
GnuPlot

Plotly

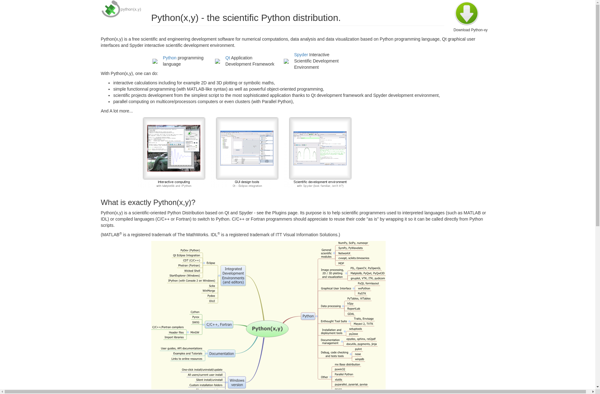
Python(x,y)
Matplotlib
