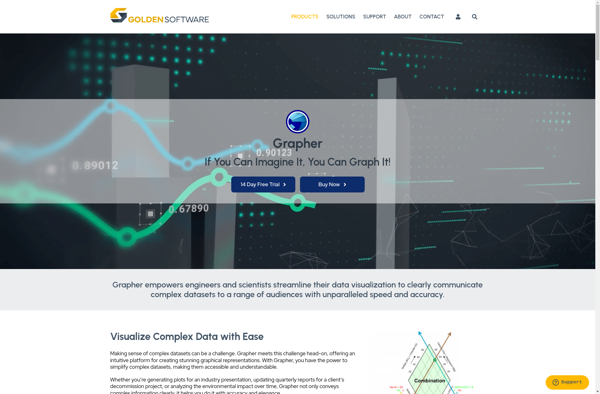
Golden Software Grapher
Description: Golden Software Grapher is a 2D and 3D scientific graphing and data visualization software. It allows users to easily create a wide variety of graphs and charts and customize them. Grapher can handle large complex datasets and has capabilities like contouring and surface mapping.
Type: software
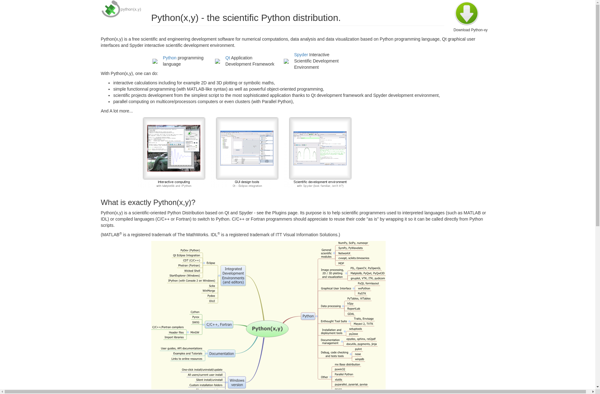
python(x,y)
Description: python(x,y) is an open-source mathematical plotting and data visualization library for the Python programming language. It provides a simple interface for creating 2D plots, histograms, power spectra, bar charts, errorcharts, contour plots, etc.
Type: software
Pricing: Open Source