Dash Reports
Description: Dash Reports is a business intelligence and reporting software that allows users to connect to data sources, build interactive reports and dashboards, and share insights. It has drag-and-drop functionality, making report building simple for non-technical users.
Type: software
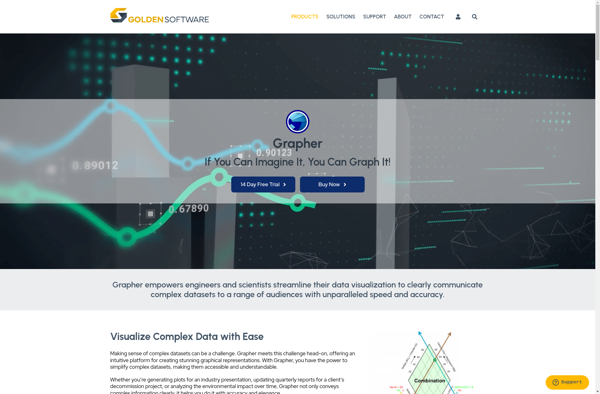
Golden Software Grapher
Description: Golden Software Grapher is a 2D and 3D scientific graphing and data visualization software. It allows users to easily create a wide variety of graphs and charts and customize them. Grapher can handle large complex datasets and has capabilities like contouring and surface mapping.
Type: software