CODAP

CODAP

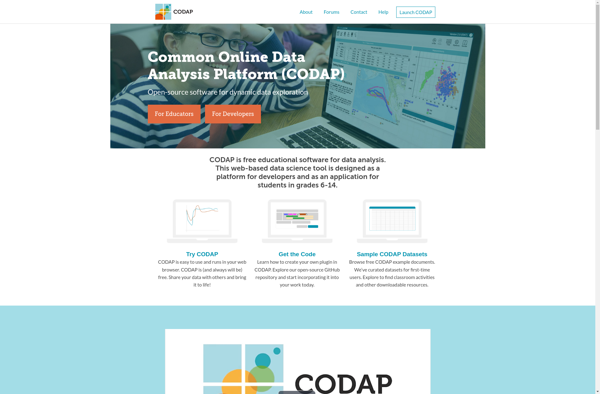
CODAP is an interactive data analysis and visualization tool optimized for students to explore real-world data sets and build models, graphs, and stories. It helps engage students in critical thinking to understand concepts in statistics, math, science, and social studies.
CODAP image
data-visualization statistics math science education

CODAP: Interactive Data Analysis & Visualization Tool

Interactive data analysis and visualization tool for students, optimizing exploration of real-world datasets and model building, graphing, and storytelling.

What is CODAP?

CODAP (Common Online Data Analysis Platform) is a free, interactive, web-based data exploration, analysis, and visualization tool designed specifically for use in education. It enables students in grades 6-14 to analyze authentic, real-world data in an engaging, accessible way to support computational thinking, quantitative reasoning, and conceptual understanding across various subjects including statistics, mathematics, science, and social studies.

Some key features of CODAP include:

  • Interactive graphical data displays like scatter plots, histograms, bar charts, pie charts, maps, etc. that students can dynamically modify to explore data
  • Powerful analysis tools for computing statistics, transforming variables, filtering cases, highlighting subsets and extremes in the data
  • Capability to import a wide variety of data formats from local files or online sources
  • Collaboration tools that allow students to share data, visualizations, and findings with others
  • Integrated curriculum activities and guided investigations to scaffold student inquiries
  • Teacher dashboard for monitoring student progress and understanding
  • Accessibility features to support all learners including descriptive annotations and tags

CODAP was developed at the Concord Consortium and Tufts University with support from the National Science Foundation. It is currently used by thousands of teachers globally to enable data-driven approaches to learning and thinking critically about real phenomena.

CODAP Features

Features

  1. Interactive data visualization
  2. Real-time graphing and analysis
  3. Model building
  4. Collaboration tools
  5. Customizable interface
  6. Supports various data formats (CSV, JSON, etc)

Pricing

  • Free

Pros

Engages students through interactivity

Allows exploration of real-world data

Develops data literacy skills

Easy to use and learn

Free and open source

Cons

Limited chart types compared to advanced tools

Less control over styling visuals

Not many advanced analysis features

Requires training and guidance to fully utilize


The Best CODAP Alternatives

Top Education & Reference and Data Analysis and other similar apps like CODAP


Microsoft Excel icon

Microsoft Excel

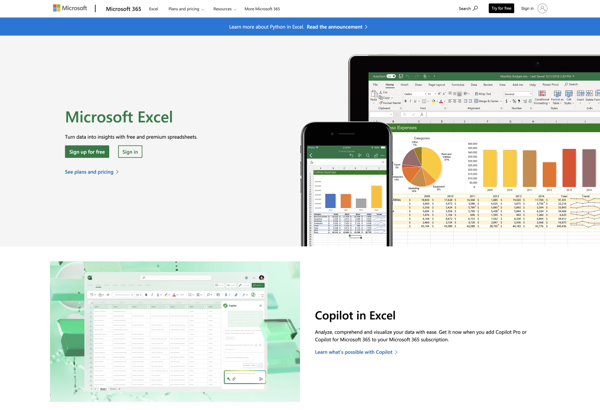
Microsoft Excel stands as the quintessential spreadsheet software, offering unparalleled versatility and functionality for individuals and businesses alike. A cornerstone of the Microsoft Office suite, Excel empowers users to organize, analyze, and interpret data efficiently. Its grid of cells allows for the creation of complex calculations, making it an indispensable...
Microsoft Excel image
LibreOffice - Calc icon

LibreOffice - Calc

LibreOffice Calc is the spreadsheet component of the LibreOffice suite, offering users a robust, open-source alternative for managing and analyzing data. As part of the free and open-source software movement, LibreOffice Calc provides a cost-effective and feature-rich solution for individuals, businesses, and organizations looking to break away from proprietary spreadsheet...
Google Sheets icon

Google Sheets

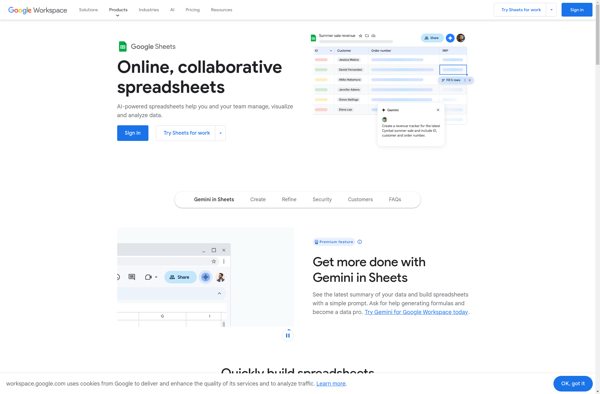
Google Sheets is a spreadsheet program developed by Google as part of its free, web-based Google Workspace productivity suite. It features the ability to create, view, edit and collaborate on spreadsheets online in real time. Key features of Google Sheets include:Create and edit spreadsheets with cells for different types of...
Google Sheets image
GeoGebra icon

GeoGebra

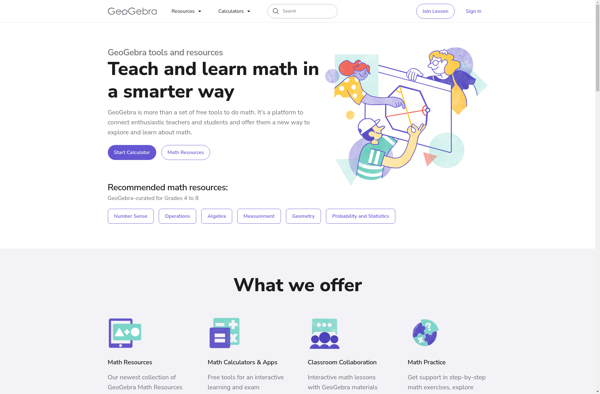
GeoGebra is a free, open-source dynamic mathematics software that can be used for teaching and learning mathematics at all levels of education. It combines geometry, algebra, spreadsheets, graphing, statistics and calculus in one easy-to-use and well-integrated package making it an excellent tool for demonstrating mathematical concepts.Some of the key features...
GeoGebra image
Gnumeric icon

Gnumeric

Gnumeric is an free, open source spreadsheet program created to be a lightweight alternative to software like Microsoft Excel. It is designed to provide many of the common features found in Excel while using less system resources and without expensive licensing fees.Some key features of Gnumeric include:Support for a wide...
Gnumeric image
Apache OpenOffice Calc icon

Apache OpenOffice Calc

Apache OpenOffice Calc is a free, open source spreadsheet application that is part of the Apache OpenOffice software suite. It includes features similar to commercial spreadsheet programs like Microsoft Excel.Some key features and capabilities of Apache OpenOffice Calc include:Perform calculations and analyze data using formulas and functionsGenerate 2D and 3D...
Apache OpenOffice Calc image
Arcane Sheets icon

Arcane Sheets

Arcane Sheets is a feature-rich spreadsheet application built for efficient data analysis and reporting. With its intuitive interface, advanced calculation engine, and built-in business intelligence tools, Arcane Sheets combines the flexibility of traditional spreadsheets with the power of dedicated data analysis software.Key features of Arcane Sheets include:Powerful calculation engine -...