Matplotlib
Description: Matplotlib is a comprehensive 2D plotting library for Python that allows users to create a wide variety of publication-quality graphs, charts, and visualizations. It integrates well with NumPy and Pandas data structures.
Type: software
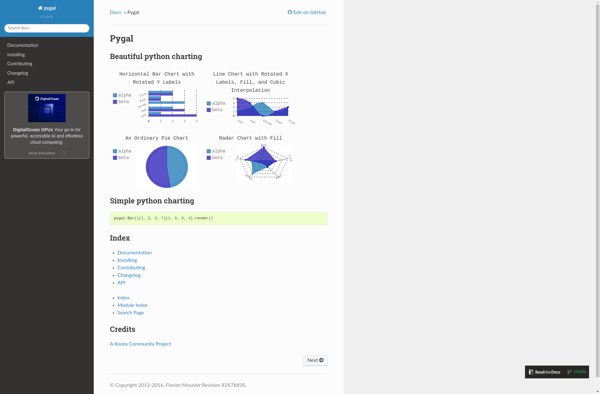
Pygal
Description: Pygal is a Python charting library that allows you to generate SVG charts from data. Some key features include support for various chart types like bar charts, pie charts, line charts etc., customizable styles and themes, and integration with major Python web frameworks.
Type: software
Pricing: Open Source