ActiveChart
ActiveChart: Interactive JavaScript Charting Library
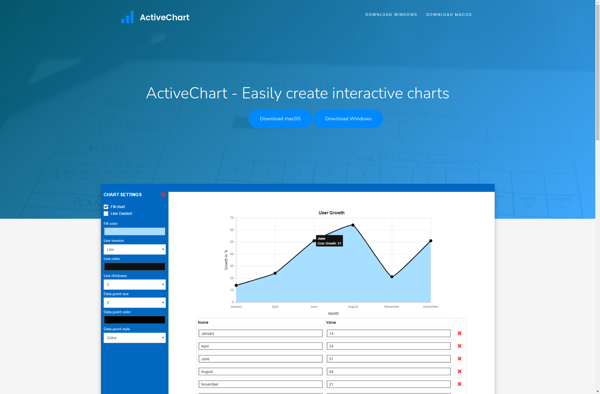
Interactive charting library for building dynamic, interactive charts, graphs and data visualizations in web apps. Supports various chart types like line, bar, pie and more with customization options.
What is ActiveChart?
ActiveChart is a feature-rich JavaScript charting library for adding interactive data visualizations to web apps and sites. It lets developers easily create dynamic charts and graphs that respond to user input and data changes.
Some key features of ActiveChart include:
- Support for different chart types like line, bar, pie, donut, area, scatter, etc.
- Extensive customization options - colors, labels, tooltips, legend, axes, themes, etc.
- Responsive design that automatically adjusts chart size for mobile/tablet screens
- Touch support, zooming and panning for chart interaction
- Animation effects for interesting visual flair
- Client-side only, no dependencies other than native JavaScript
- Compatible across modern browsers
- MIT license for free commercial and non-commercial use
ActiveChart simplifies adding beautiful, interactive visualizations like KPI widgets, dashboards, reports and more to any web project. Its lightweight footprint, flexibility and ease of use makes it a good option for dynamically displaying changing data.
ActiveChart Features
Features
- Interactive JavaScript charting library
- Support for various chart types (line, bar, pie, etc.)
- Customization options for charts and graphs
- Dynamic data visualization in web applications
Pricing
- Open Source
Pros
Cons
Official Links
Reviews & Ratings
Login to ReviewThe Best ActiveChart Alternatives
View all ActiveChart alternatives with detailed comparison →
Top Office & Productivity and Data Visualization and other similar apps like ActiveChart
ZoomCharts

Koia

RAWGraphs
