Kroki is an open-source diagram generation tool that converts text descriptions into diagrams and flowcharts. It supports various diagram types like sequence diagrams, flowcharts, entity relationship diagrams, and more. Kroki is lightweight, customizable, and easy to integrate in
Kroki is an open-source diagram generation tool that converts text descriptions into diagrams and flowcharts. It supports various diagram types like sequence diagrams, flowcharts, entity relationship diagrams, and more. Kroki is lightweight, customizable, and easy to integrate into websites and applications.
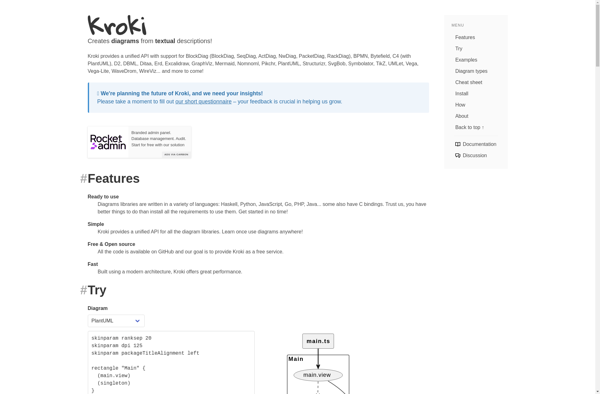
What is Kroki?
Kroki is an open-source diagram generation tool that allows creating diagrams just by writing simple textual descriptions. It can automatically convert those text descriptions into beautiful diagrams and flowcharts. Kroki supports a wide range of popular diagram types including:
Sequence diagrams
Flowcharts
Entity relationship diagrams
State diagrams
Class diagrams
Gantt charts
Some key features and benefits of Kroki include:
Lightweight and easy to deploy - Kroki has no dependencies and runs as a single jar file
Customizable - Styles and themes can be customized
Extensible - Additional diagram types can be added by writing plugins
Integration friendly - Kroki provides REST API out of the box to integrate with other tools
Free and open-source - Kroki is licensed under Apache 2.0 license
Overall, Kroki is a great option if you need to generate diagrams dynamically for your documentation or website. With its simple text-based approach, it makes it easy to produce quality diagrams without needing to use visual diagramming software.
Kroki Features
Features
Supports various diagram types like sequence diagrams, flowcharts, ER diagrams, etc
Lightweight and easy to integrate into websites and applications
Open source and customizable
Converts text descriptions into diagrams and flowcharts
Has plugins to extend functionality and add new diagram types
Microsoft Office Visio is diagramming and vector graphics software developed by Microsoft. It is used to create a wide variety of business diagrams and visualizations including flowcharts, organizational charts, network diagrams, workflows, floorplans, and more.Key features of Visio include:Hundreds of professionally-designed templates for quick diagram creationIntuitive drag-and-drop interface to easily...
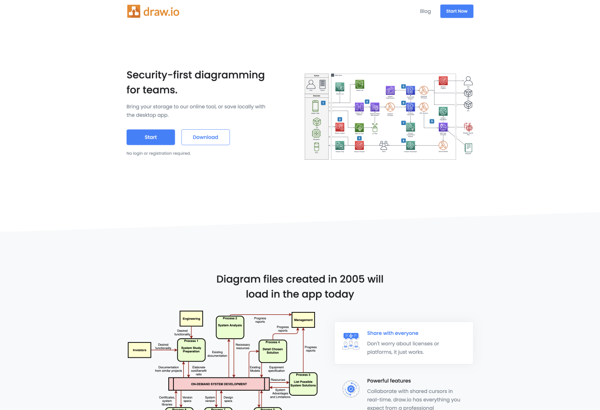
draw.io is a feature-rich diagramming and flowchart software that runs in your web browser. As a freemium tool, draw.io offers a free basic version as well as paid plans with more functionality for professionals and teams.With an intuitive drag-and-drop interface and built-in shape libraries, draw.io makes it easy for anyone...
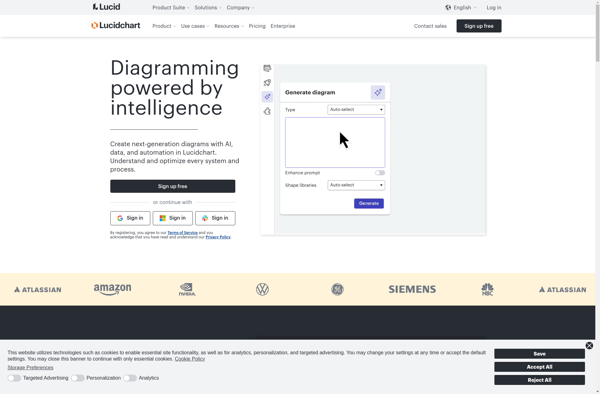
Lucidchart is a cloud-based diagramming application that allows users to collaborate and share diagrams in real time. It is used by over 30 million users and integrates with popular applications like Google Workspace, Microsoft Office 365, Confluence, and Jira.With an intuitive drag-and-drop interface, Lucidchart makes it easy for anyone to...
Mermaid is an open-source visualization tool that allows users to create a variety of charts, diagrams, and visualizations using a simple text-based language. Some of the key benefits and capabilities of Mermaid include:Text-based - No need to use cumbersome GUI diagram editors. Diagrams are defined using a markdown-inspired text language...
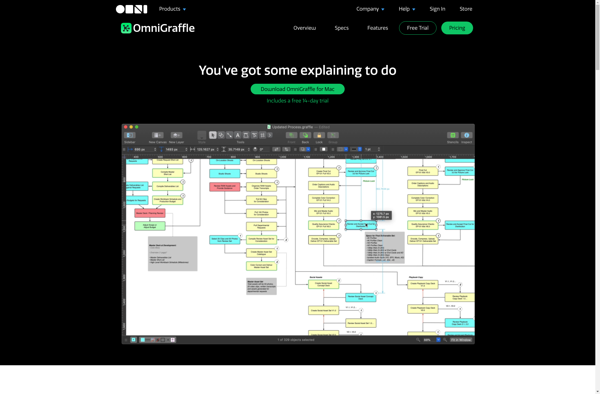
OmniGraffle is a powerful, versatile diagramming application developed by The Omni Group for macOS and iOS. First released in 2001, OmniGraffle enables users to create a wide range of diagrams, charts, illustrations, and graphic documents.With an intuitive and flexible interface, OmniGraffle makes it easy to quickly map out concepts, ideas,...
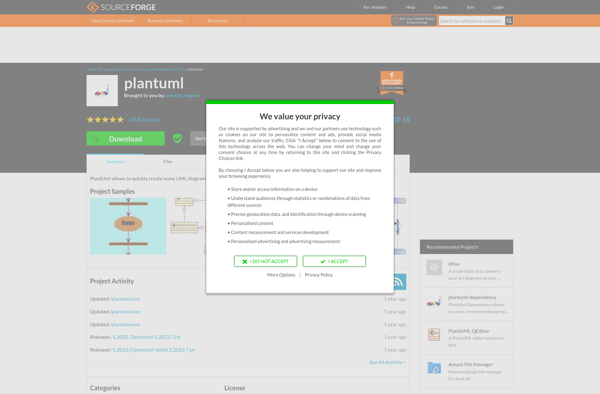
PlantUML is an open-source tool used for rapidly creating UML diagrams from a plain text language. It supports all standard UML diagrams like use case diagrams, component diagrams, class diagrams, sequence diagrams, state diagrams, activity diagrams, etc. The main goal of PlantUML is to provide a simple and efficient way...
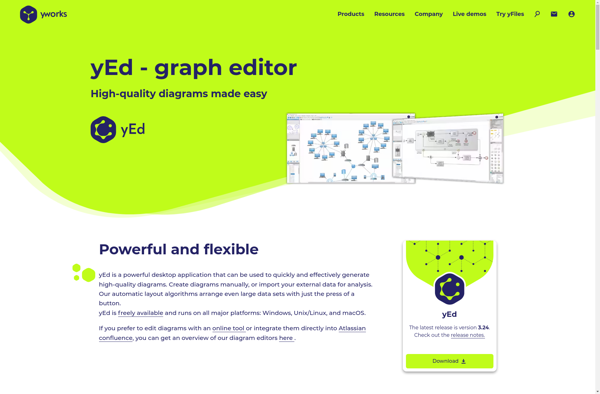
yEd Graph Editor is a free, powerful desktop application for Windows, macOS and Linux that can be used to quickly and easily create diagrams. It supports a wide range of diagram types including flowcharts, network diagrams, UML diagrams, BPMN diagrams, mind maps, organization charts, and more.Some key features of yEd...
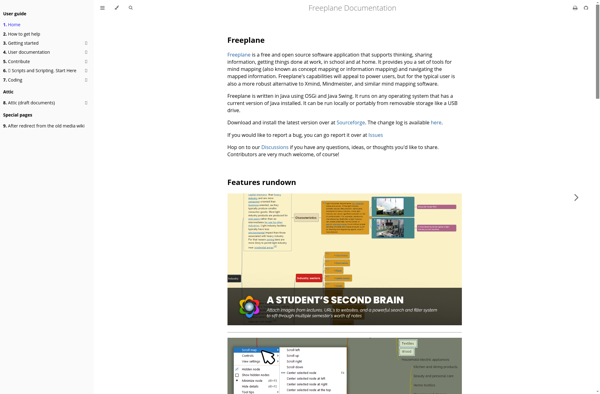
Freeplane is an open source and free mind mapping and knowledge management software. It allows users to visually organize ideas, tasks, projects, and concepts in a node-based map interface. The software aims to help users brainstorm ideas, structure thoughts, and manage information visually.Some key features of Freeplane include:Intuitive drag-and-drop interface...
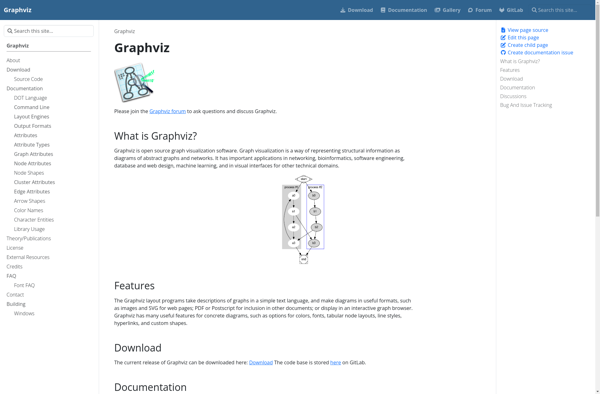
Graphviz is an open-source graph visualization software package developed by AT&T; Research. It is used for representing structural information as diagrams of abstract graphs and networks.Graphviz allows users to create a variety of graph and network types, including directed graphs, undirected graphs, hierarchies, and more. Some of the key features...
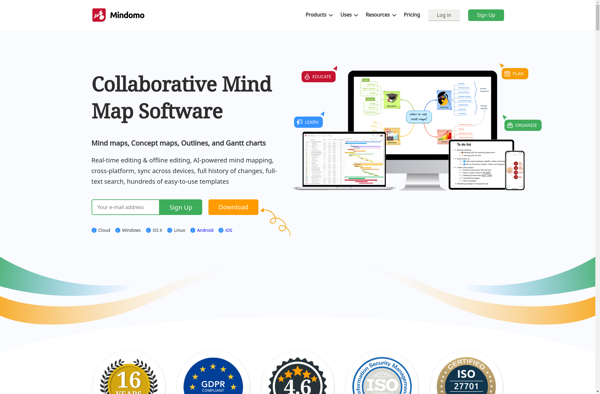
Mindomo is an user-friendly online mind mapping and brainstorming software. It enables individuals and teams to visually organize ideas, concepts, notes, tasks and documents into flexible and customizable mind maps. The interactive maps make it easy to structure information visually for better comprehension and recall.Key features of Mindomo include:Intuitive drag-and-drop...