blockdiag

Blockdiag

blockdiag is an open-source Python library and command-line tool that generates block-style diagram images from simple text files. It supports multiple diagram types like block diagrams, sequence diagrams, activity diagrams, and more.
blockdiag image
diagram block-diagram sequence-diagram activity-diagram

blockdiag: Open-Source Python Library for Block Diagrams

Blockdiag generates block-style diagram images from simple text files, supporting various diagram types including block diagrams, sequence diagrams, and activity diagrams.

What is Blockdiag?

blockdiag is an open-source Python library and command-line tool for generating various types of block-style diagrams from simple text files. It was created to help software developers visualize systems and structures in a simple, fast way without needing to use full-featured diagramming software.

Some key features and capabilities of blockdiag include:

  • Supports different types of diagrams out of the box including block diagrams, sequence diagrams, activity diagrams, logical network diagrams, and more
  • Simple syntax for defining nodes and connections between them
  • Automatic layout and styling of diagrams
  • Configurable styling through themes and custom CSS
  • Image output in PNG, SVG, and other formats
  • Integration with Sphinx documentation generator
  • Command-line interface and Python API for automation

blockdiag makes it easy to visualize architectures, flows, relationships and other aspects of complex systems. Instead of using graphical editors, the text-based syntax allows developers to generate diagrams programmatically and include them in documentation and reports. The automatic layout algorithms reduce the effort of manually positioning elements.

It's a useful tool for software engineers, system administrators, technical writers, and others who need to create simple but effective diagrams to document systems and applications.

Blockdiag Features

Features

  1. Generates block-style diagrams from simple text files
  2. Supports multiple diagram types like block diagrams, sequence diagrams, activity diagrams
  3. Open-source Python library and command-line tool
  4. Customizable with configuration files and theming
  5. Automatic layout of diagram elements

Pricing

  • Open Source

Pros

Simple text-based syntax

Good for documenting architecture and workflows

Extensible and customizable

Available on multiple platforms

Cons

Limited built-in shape libraries

Steeper learning curve than GUI diagram tools

Rendering complex diagrams can be slow


The Best Blockdiag Alternatives

Top Development and Diagramming and other similar apps like Blockdiag


Mermaid icon

Mermaid

Mermaid is an open-source visualization tool that allows users to create a variety of charts, diagrams, and visualizations using a simple text-based language. Some of the key benefits and capabilities of Mermaid include:Text-based - No need to use cumbersome GUI diagram editors. Diagrams are defined using a markdown-inspired text language...
Mermaid image
PlantUML icon

PlantUML

PlantUML is an open-source tool used for rapidly creating UML diagrams from a plain text language. It supports all standard UML diagrams like use case diagrams, component diagrams, class diagrams, sequence diagrams, state diagrams, activity diagrams, etc. The main goal of PlantUML is to provide a simple and efficient way...
PlantUML image
Gephi icon

Gephi

Gephi is an open-source, cross-platform network analysis and visualization software package developed in Java. It allows users to visualize, interactively explore, spatially arrange, manipulate, and statistically analyze network graphs made up of nodes and edges. Gephi provides easy and broad access to complex network data in order to help applied...
Gephi image
YEd Graph Editor icon

YEd Graph Editor

yEd Graph Editor is a free, powerful desktop application for Windows, macOS and Linux that can be used to quickly and easily create diagrams. It supports a wide range of diagram types including flowcharts, network diagrams, UML diagrams, BPMN diagrams, mind maps, organization charts, and more.Some key features of yEd...
YEd Graph Editor image
Graphviz icon

Graphviz

Graphviz is an open-source graph visualization software package developed by AT&T; Research. It is used for representing structural information as diagrams of abstract graphs and networks.Graphviz allows users to create a variety of graph and network types, including directed graphs, undirected graphs, hierarchies, and more. Some of the key features...
Graphviz image
Linkurious icon

Linkurious

Linkurious is a software designed specifically for graph visualization and network analysis. It allows users to load their network data, such as connections between people, transactions, or communication records, and visualize these connections in an interactive graphical interface.Some key features of Linkurious include:Powerful graph visualization with automatic layouts that spotlight...
Linkurious image
KeyLines Graph Visualization Toolkit icon

KeyLines Graph Visualization Toolkit

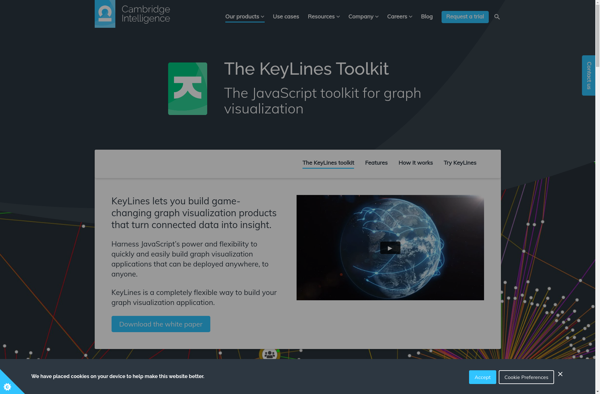
KeyLines is an open-source JavaScript library for creating interactive network and graph visualizations on the web. It is designed to allow developers to easily generate node-link diagrams, charts, and graphs from data sources like JSON and CSV.Some key features of KeyLines include:Generates common graph layouts like force-directed, circular, tree, etc.Customizable...
KeyLines Graph Visualization Toolkit image
Delineato Pro icon

Delineato Pro

Delineato Pro is a feature-rich vector graphics and illustration application for Windows. It provides a wide range of versatile tools for creating detailed and precise vector artwork, diagrams, logos, icons, typography designs and more.The intuitive user interface resembles traditional drawing software, making it easy to pick up for beginners and...
Delineato Pro image
Graphynx icon

Graphynx

Graphynx is an open-source, cross-platform software tool for graph and network analysis. It enables users to visualize, analyze, and manipulate different types of graph data structures such as social networks, transportation systems, family trees, and more.Key features of Graphynx include:Interactive graph visualization with support for different layout algorithms such as...
Diagrammix icon

Diagrammix

Diagrammix is a feature-rich, open-source diagram and flowchart software. As an alternative to proprietary tools like Microsoft Visio or Lucidchart, Diagrammix provides a free and cross-platform option for creating a wide variety of diagrams and charts.Some key capabilities and benefits of Diagrammix include:Intuitive and easy-to-use interface - The software is...
Diagrammix image