Neoclipse

Neoclipse

Neoclipse is an open-source integrated development environment (IDE) for Eclipse specifically designed for Neo4j graph database application development. It provides features like graphical visualization of database schema, editing Cypher queries with syntax highlighting and auto-
Neoclipse image
graph-database ide eclipse neo4j

Neoclipse: Open-Source IDE for Neo4j Graph Database

An open-source integrated development environment (IDE) specifically designed for Neo4j graph database application development, featuring database schema visualization, Cypher query editing with syntax highlighting and auto-completion, and more.

What is Neoclipse?

Neoclipse is an open-source integrated development environment (IDE) built on top of the Eclipse platform and tailored for developing applications with the Neo4j graph database. Some key features of Neoclipse include:

  • Graphical schema viewer - Visualize and navigate the node and relationship schema of your Neo4j database.
  • Enhanced Cypher editor - Write and execute Cypher queries against your database with features like syntax highlighting, auto-completion, query parameter assistance, etc.
  • Database browser - Browse and edit the contents of your Neo4j database through Neoclipse's user interface.
  • Integrated query runner and result viewer - Run Cypher queries and view query results and statistics right within the Neoclipse workbench.
  • Visual graph result display - See graphical representations of node-relationship query results.
  • Plug-in extensibility - Extend Neoclipse's functionality by installing add-ons from the Eclipse marketplace.

Neoclipse aims to improve developer productivity by providing a feature-rich IDE tailored specifically for Neo4j application development. It works with both remote and local Neo4j databases. The project is open-source and implemented in Java as a set of Eclipse plug-ins.

Neoclipse Features

Features

  1. Graphical visualization of database schema
  2. Editing Cypher queries with syntax highlighting and auto-completion
  3. Integrated database browser and query runner

Pricing

  • Open Source
  • Free

Pros

Open source and free

Designed specifically for Neo4j development

Visualization aids development and debugging

Auto-completion speeds up coding

Integrated tools improve workflow

Cons

Limited to Neo4j only

Not as full-featured as some commercial IDEs

Smaller user community than major IDEs


The Best Neoclipse Alternatives

Top Development and Database Tools and other similar apps like Neoclipse


OmniGraffle icon

OmniGraffle

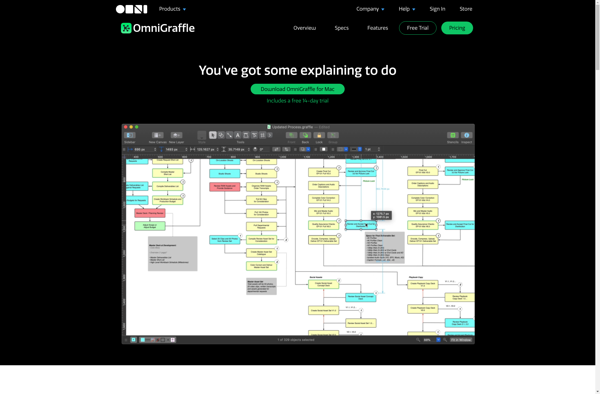
OmniGraffle is a powerful, versatile diagramming application developed by The Omni Group for macOS and iOS. First released in 2001, OmniGraffle enables users to create a wide range of diagrams, charts, illustrations, and graphic documents.With an intuitive and flexible interface, OmniGraffle makes it easy to quickly map out concepts, ideas,...
OmniGraffle image
PlantUML icon

PlantUML

PlantUML is an open-source tool used for rapidly creating UML diagrams from a plain text language. It supports all standard UML diagrams like use case diagrams, component diagrams, class diagrams, sequence diagrams, state diagrams, activity diagrams, etc. The main goal of PlantUML is to provide a simple and efficient way...
PlantUML image
Gephi icon

Gephi

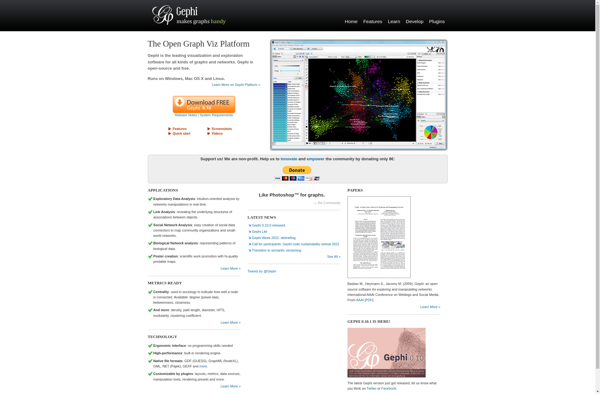
Gephi is an open-source, cross-platform network analysis and visualization software package developed in Java. It allows users to visualize, interactively explore, spatially arrange, manipulate, and statistically analyze network graphs made up of nodes and edges. Gephi provides easy and broad access to complex network data in order to help applied...
Gephi image
YEd Graph Editor icon

YEd Graph Editor

yEd Graph Editor is a free, powerful desktop application for Windows, macOS and Linux that can be used to quickly and easily create diagrams. It supports a wide range of diagram types including flowcharts, network diagrams, UML diagrams, BPMN diagrams, mind maps, organization charts, and more.Some key features of yEd...
YEd Graph Editor image
Graphviz icon

Graphviz

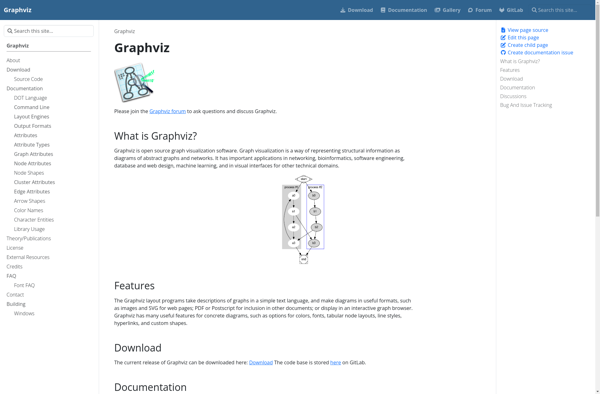
Graphviz is an open-source graph visualization software package developed by AT&T; Research. It is used for representing structural information as diagrams of abstract graphs and networks.Graphviz allows users to create a variety of graph and network types, including directed graphs, undirected graphs, hierarchies, and more. Some of the key features...
Graphviz image
Linkurious icon

Linkurious

Linkurious is a software designed specifically for graph visualization and network analysis. It allows users to load their network data, such as connections between people, transactions, or communication records, and visualize these connections in an interactive graphical interface.Some key features of Linkurious include:Powerful graph visualization with automatic layouts that spotlight...
Linkurious image
Cytoscape icon

Cytoscape

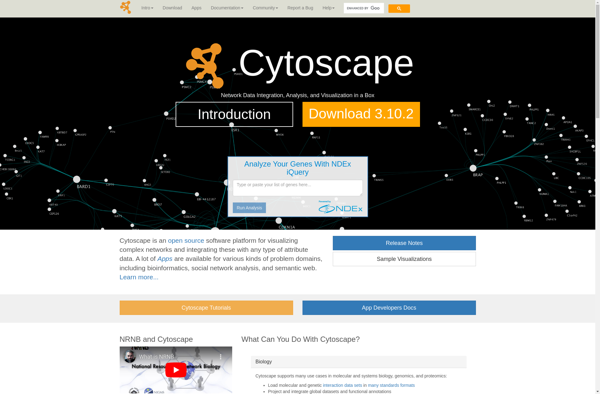
Cytoscape is an open source software platform for visualizing complex networks and integrating these with any type of attribute data. It allows researchers to visualize molecular interaction networks and biological pathways, gene regulation networks, and social networks. Some key features of Cytoscape include:Interactive visualizations with support for layouts, zooming, labeling,...
Cytoscape image
NodeXL icon

NodeXL

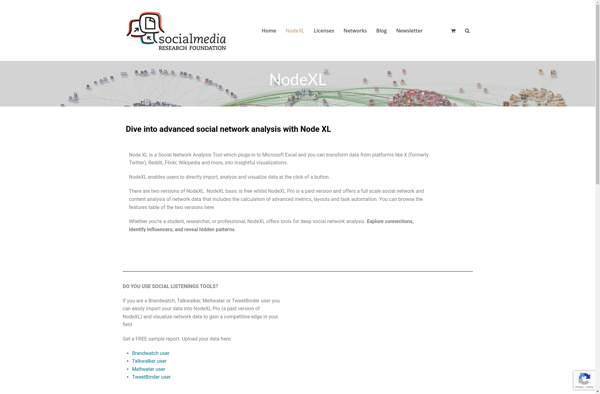
NodeXL is an open-source template for Microsoft Excel that makes network analysis and visualization easy. It allows users to explore network graphs and analyze network data from within Excel.Some key features and benefits of NodeXL include:Imports network data from a variety of sources including social media, email, bibliographic databases, and...
NodeXL image
Grapholite icon

Grapholite

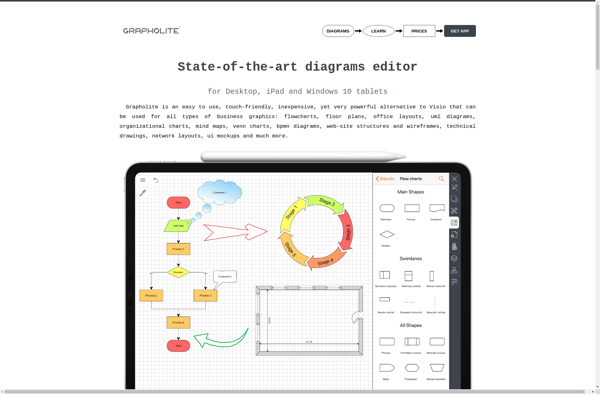
Grapholite is an open-source, cross-platform diagramming and vector graphics application. It allows users to easily create a wide variety of diagrams and charts such as flowcharts, UML diagrams, network diagrams, graphs, organizational charts, and more.Some of the key features of Grapholite include:Intuitive and easy-to-use interface for creating different types of...
Grapholite image
GraphXR icon

GraphXR

GraphXR is a powerful yet user-friendly data visualization and analytics platform used by individuals and organizations to turn complex data into meaningful, interactive visualizations. With an intuitive drag-and-drop interface, GraphXR makes it simple for anyone to build customized dashboards, reports, and graphs to uncover trends, outliers, and insights hidden in...
GraphXR image