Cytoscape is an open source software platform for visualizing complex networks and integrating these with any type of attribute data. It provides a lot of features for network analysis and visualization.
Cytoscape is an open source software platform for visualizing complex networks and integrating these with any type of attribute data. It provides a lot of features for network analysis and visualization.
What is Cytoscape?
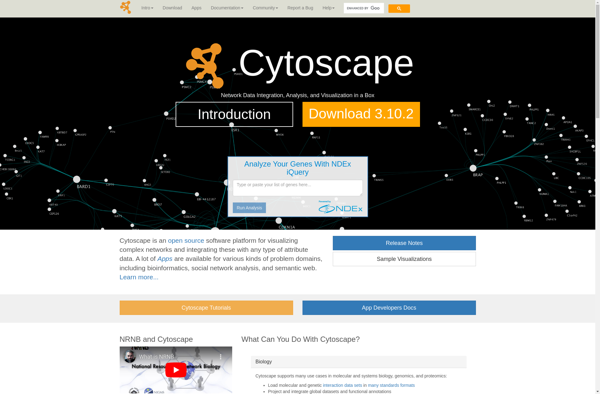
Cytoscape is an open source software platform for visualizing complex networks and integrating these with any type of attribute data. It allows researchers to visualize molecular interaction networks and biological pathways, gene regulation networks, and social networks. Some key features of Cytoscape include:
Interactive visualizations with support for layouts, zooming, labeling, coloring
Analysis tools for network clustering, enrichment, filtering
Integration of node/edge/network data and attributes
Customizable appearance with themes and visual styles
Extensible via apps and plugins
Scripting and automation options
Export network images, data tables, and files
Collaboration features to share networks with other users
Cytoscape helps researchers gain insights into the organization and dynamics of molecular interaction networks by integrating experimental data with annotation data, analyzing networks, and allowing interactive visual exploration. Its open architecture allows developers to extend and customize its functionality for specific research needs.
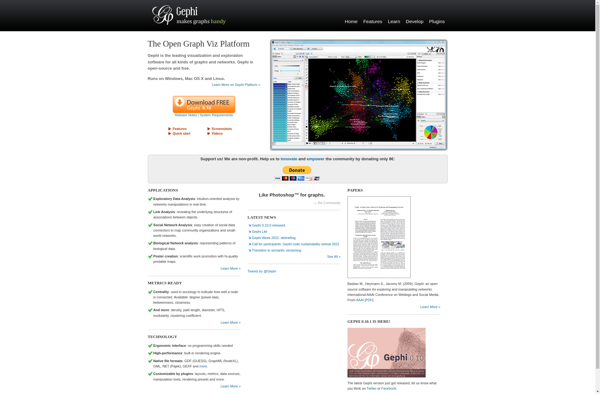
Gephi is an open-source, cross-platform network analysis and visualization software package developed in Java. It allows users to visualize, interactively explore, spatially arrange, manipulate, and statistically analyze network graphs made up of nodes and edges. Gephi provides easy and broad access to complex network data in order to help applied...
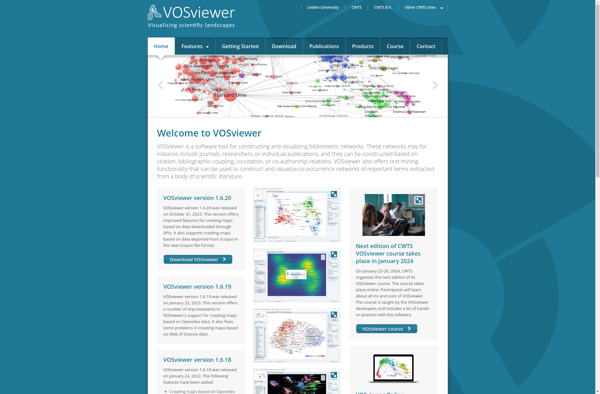
VOSviewer is a software tool for constructing and visualizing bibliometric networks. It is freely available for downloading and using. VOSviewer can construct maps based on network data such as citation or co-citation networks, and explore them visually. Some of the key features of VOSviewer are:- It can construct maps based...
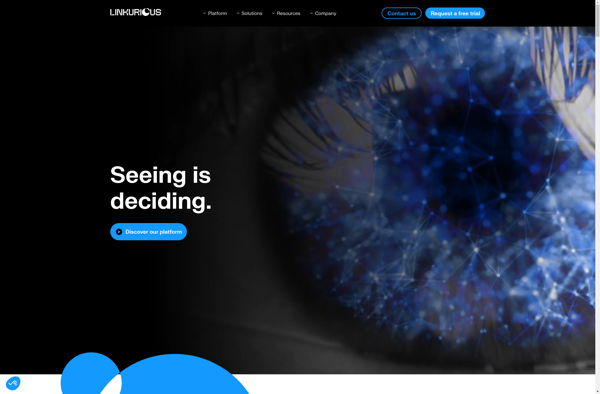
Linkurious is a software designed specifically for graph visualization and network analysis. It allows users to load their network data, such as connections between people, transactions, or communication records, and visualize these connections in an interactive graphical interface.Some key features of Linkurious include:Powerful graph visualization with automatic layouts that spotlight...
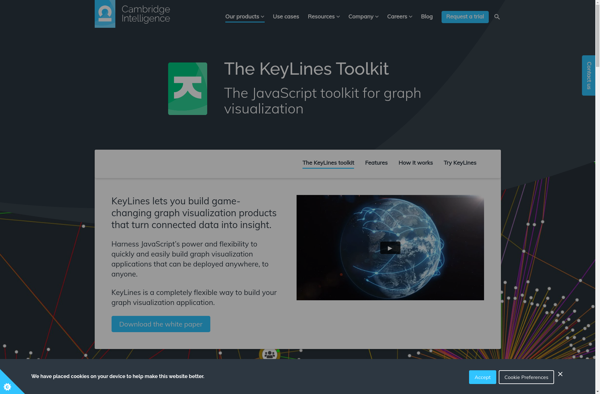
KeyLines is an open-source JavaScript library for creating interactive network and graph visualizations on the web. It is designed to allow developers to easily generate node-link diagrams, charts, and graphs from data sources like JSON and CSV.Some key features of KeyLines include:Generates common graph layouts like force-directed, circular, tree, etc.Customizable...
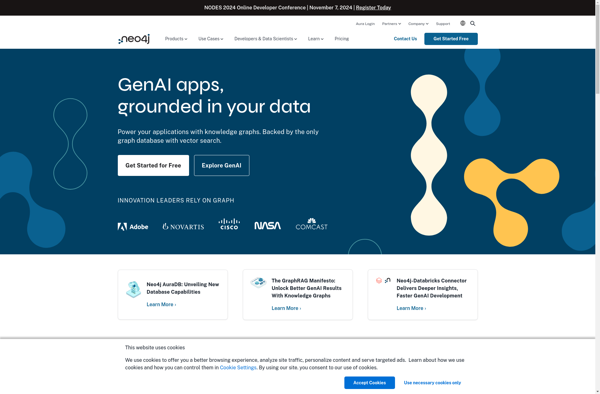
Neoclipse is an open-source integrated development environment (IDE) built on top of the Eclipse platform and tailored for developing applications with the Neo4j graph database. Some key features of Neoclipse include:Graphical schema viewer - Visualize and navigate the node and relationship schema of your Neo4j database.Enhanced Cypher editor - Write...
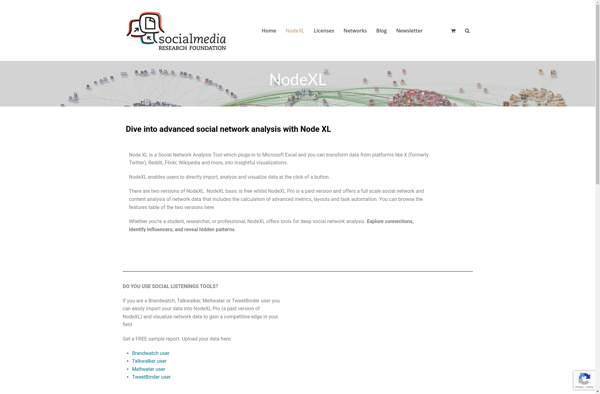
NodeXL is an open-source template for Microsoft Excel that makes network analysis and visualization easy. It allows users to explore network graphs and analyze network data from within Excel.Some key features and benefits of NodeXL include:Imports network data from a variety of sources including social media, email, bibliographic databases, and...
Wandora is an open source software application designed for qualitative data analysis, research information organization, visualization and publishing. It can be used for a wide range of qualitative research tasks including coding, annotating, analyzing and visualizing qualitative and mixed data sets.Some of the key features of Wandora include:Support for managing...
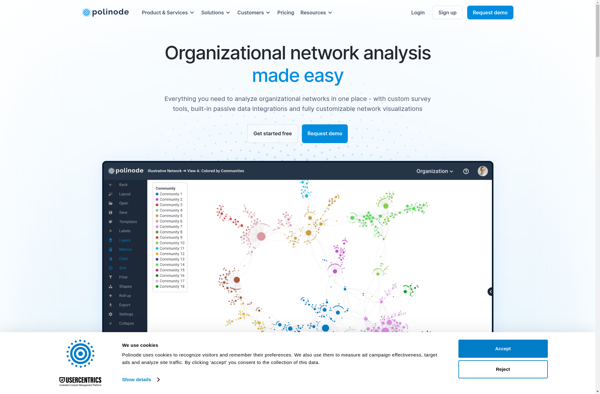
Polinode is an open-source platform aimed at democratizing machine learning and making it more accessible. It allows users to build, train, and deploy machine learning models through a visual no-code interface without needing to write any code.Some key features and benefits of Polinode include:Visual workflow builder with drag-and-drop components for...
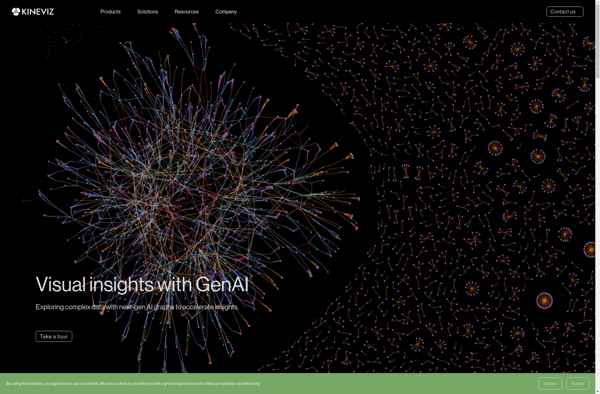
GraphXR is a powerful yet user-friendly data visualization and analytics platform used by individuals and organizations to turn complex data into meaningful, interactive visualizations. With an intuitive drag-and-drop interface, GraphXR makes it simple for anyone to build customized dashboards, reports, and graphs to uncover trends, outliers, and insights hidden in...
Socilyzer is a comprehensive social media management platform designed to help brands, businesses, and individuals manage their social media more effectively. It provides a suite of tools to streamline social media workflows, increase engagement, gain valuable insights, and save time.Some key features of Socilyzer include:Social Media Scheduling & Posting: Schedule...
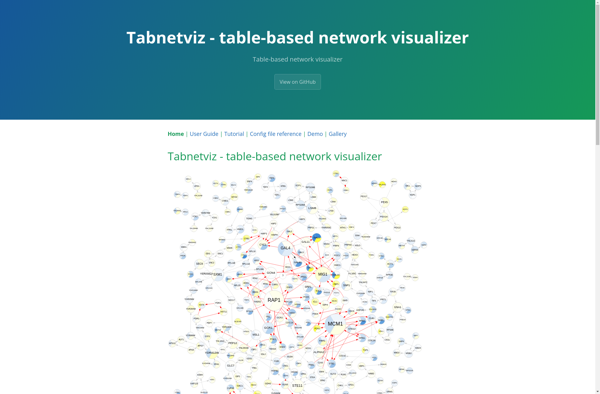
Tabnetviz is an open-source Python library that is designed to help interpret and explain TabNet models. TabNet is a neural network architecture for tabular data that can handle both classification and regression tasks. Tabnetviz generates interactive reports and visualizations that allow you to understand:Overall model performancePredictions for individual samplesGlobal feature...
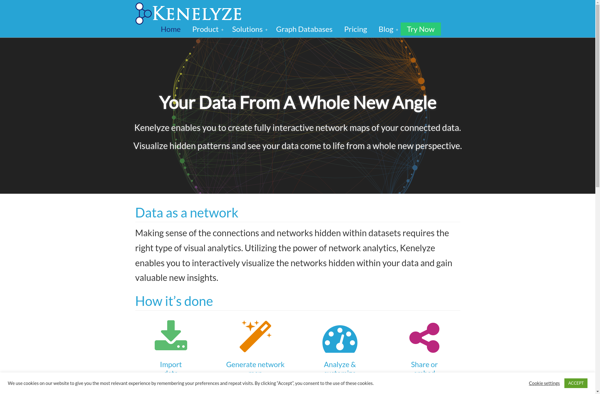
Kenelyze is a customer data platform (CDP) designed to help companies collect, unify, and activate customer data from various sources in order to drive revenue growth, improve marketing effectiveness, and deliver personalized customer experiences across channels.Key capabilities and benefits include:Consolidating customer data from diverse sources like CMS, CRM, mobile apps,...