Tabnetviz

Tabnetviz

Tabnetviz is an open-source library for interpreting trained TabNet models. It generates interactive reports to explain predictions and feature importance scores.
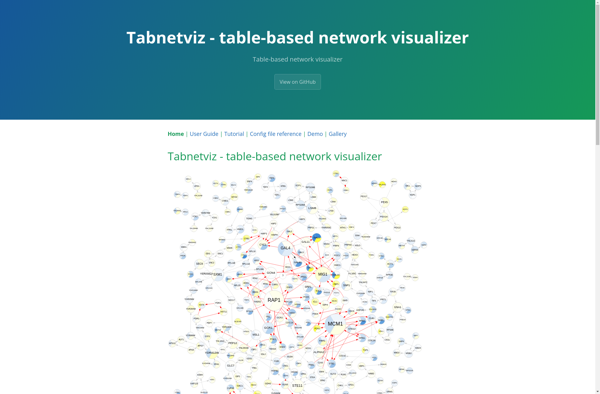
Tabnetviz image
machine-learning deep-learning model-explanation

Tabnetviz: Open-Source Library for Interpreting Trained TabNet Models

An open-source library for explaining trained TabNet models, generating interactive reports to illustrate prediction explanations and feature importance scores.

What is Tabnetviz?

Tabnetviz is an open-source Python library that is designed to help interpret and explain TabNet models. TabNet is a neural network architecture for tabular data that can handle both classification and regression tasks. Tabnetviz generates interactive reports and visualizations that allow you to understand:

  • Overall model performance
  • Predictions for individual samples
  • Global feature importance scores
  • Feature influence on a per-sample basis

The interactive reports in Tabnetviz allow you drill down to see exactly how different features impact the predictions according to the model. This level of interpretability makes it easier to debug models, detect potential biases, and trust predictions for real-world usage. Tabnetviz supports TabNet models trained with PyTorch or TensorFlow backends.

Key capabilities include:

  • Prediction explanation for regression and classification
  • Partial dependence plots
  • Decision tree approximations
  • Feature influence maps
  • Built-in reports for analyzing overall model and out-of-sample model performance

Tabnetviz is easy to use with just a few lines of code once a TabNet model has already been trained. It is a useful toolkit for any team leveraging TabNet for tabular data tasks where model interpretability is important.

Tabnetviz Features

Features

  1. Visualize feature importance
  2. Visualize decisions in tree structures
  3. Interactive reports
  4. Model agnostic

Pricing

  • Open Source

Pros

Open source and free to use

Good for interpreting TabNet models

Interactive visualization

Model agnostic - works with other models besides TabNet

Cons

Only supports classification models

Limited to TabNet and tree-based models for now

Requires coding/implementation to use


The Best Tabnetviz Alternatives

Top Ai Tools & Services and Model Interpretation and other similar apps like Tabnetviz

Here are some alternatives to Tabnetviz:

Suggest an alternative ❐

Gephi icon

Gephi

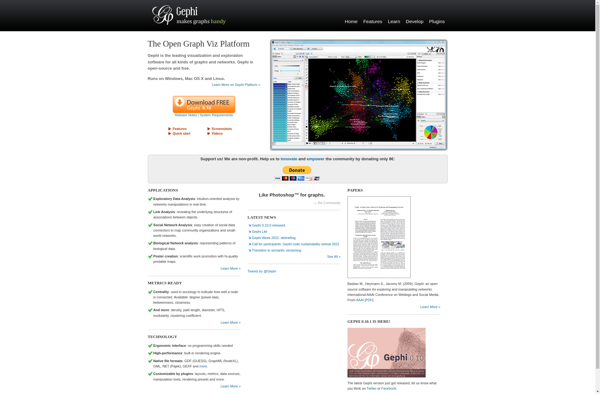
Gephi is an open-source, cross-platform network analysis and visualization software package developed in Java. It allows users to visualize, interactively explore, spatially arrange, manipulate, and statistically analyze network graphs made up of nodes and edges. Gephi provides easy and broad access to complex network data in order to help applied...
Gephi image
VOSviewer icon

VOSviewer

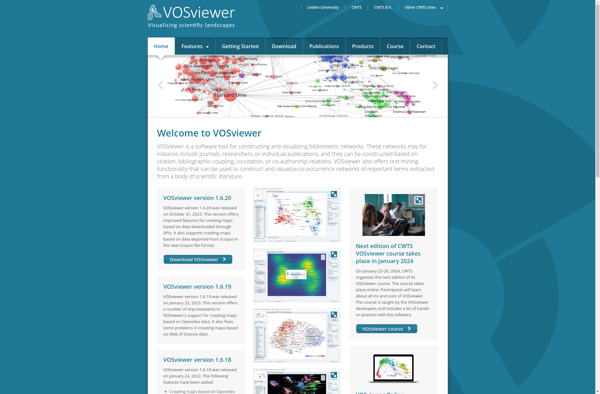
VOSviewer is a software tool for constructing and visualizing bibliometric networks. It is freely available for downloading and using. VOSviewer can construct maps based on network data such as citation or co-citation networks, and explore them visually. Some of the key features of VOSviewer are:- It can construct maps based...
VOSviewer image
Cytoscape icon

Cytoscape

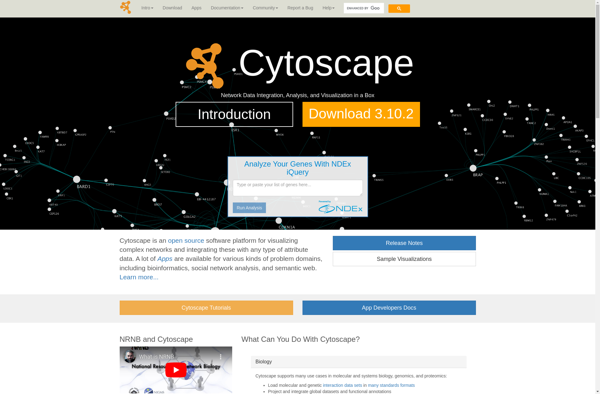
Cytoscape is an open source software platform for visualizing complex networks and integrating these with any type of attribute data. It allows researchers to visualize molecular interaction networks and biological pathways, gene regulation networks, and social networks. Some key features of Cytoscape include:Interactive visualizations with support for layouts, zooming, labeling,...
Cytoscape image
GraphXR icon

GraphXR

GraphXR is a powerful yet user-friendly data visualization and analytics platform used by individuals and organizations to turn complex data into meaningful, interactive visualizations. With an intuitive drag-and-drop interface, GraphXR makes it simple for anyone to build customized dashboards, reports, and graphs to uncover trends, outliers, and insights hidden in...
GraphXR image