JetPack Data

JetPack Data

JetPack Data is a data management platform that allows you to easily collect, organize and analyze data. It provides tools for data ingestion, storage, visualization and machine learning.
data-management data-ingestion data-storage data-visualization machine-learning

JetPack Data: Data Management Platform

A comprehensive platform for collecting, organizing, and analyzing data through ingestion, storage, visualization, and machine learning tools.

What is JetPack Data?

JetPack Data is a comprehensive data management and analytics platform designed to help companies make better use of their data. It provides a suite of tools to ingest, store, analyze, and visualize data from a variety of sources.

Key features of JetPack Data include:

  • Flexible data ingestion from databases, cloud apps, files, APIs and more
  • Scalable cloud-based data warehouse to store structured and unstructured data
  • Powerful SQL editor to query and analyze data
  • AI-powered machine learning to reveal insights
  • Customizable dashboards and visualizations
  • Collaboration tools to share data and insights across teams

Unlike other platforms, JetPack Data brings together data management and analytics into a single, easy-to-use platform. It allows companies to eliminate data silos, democratize access to insights, and build data-driven products and processes. With strong governance and security capabilities, JetPack Data can support use cases across sales, marketing, finance, supply chain, and more.

In summary, JetPack Data accelerates digital transformation for data-driven organizations by making data readily available for business analysis and decision making.

JetPack Data Features

Features

  1. Data collection APIs
  2. Cloud data storage
  3. Data visualization
  4. Machine learning APIs
  5. Workflow automation

Pricing

  • Freemium
  • Subscription-Based

Pros

Easy data ingestion

Scalable cloud storage

Intuitive UI for analysis

Pre-built ML models

Automates repetitive tasks

Cons

Can get expensive for large datasets

Limited customization for ML models

Steep learning curve for advanced features

Official Links


The Best JetPack Data Alternatives

Top Ai Tools & Services and Data Management and other similar apps like JetPack Data


Microsoft Power BI icon

Microsoft Power BI

Microsoft Power BI is a powerful business analytics service developed by Microsoft. It empowers users to transform raw data into meaningful insights, create interactive reports and dashboards, and share data-driven stories within an organization. Power BI is designed to help businesses and individuals make informed decisions based on a comprehensive...
Microsoft Power BI image
Tableau icon

Tableau

Tableau is a leading business intelligence and data visualization platform used by organizations of all sizes to transform their data into easy-to-understand visualizations and dashboards. With Tableau, users can connect to a wide range of data sources, prepare and clean the data for analysis, and create interactive data visualizations such...
Tableau image
Looker Studio icon

Looker Studio

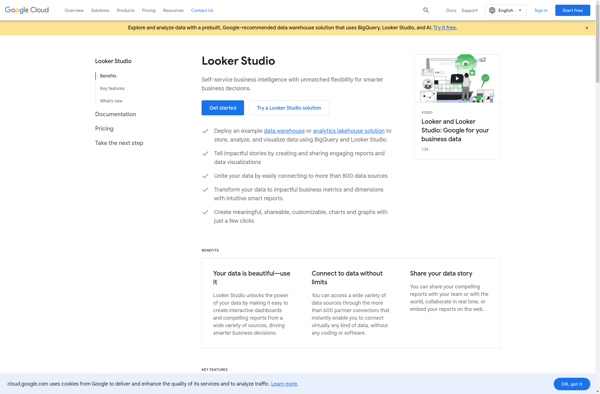
Looker Studio is a business intelligence and analytics platform designed to help companies analyze data and gain valuable insights. It provides an intuitive, web-based interface that enables users without technical skills to explore, visualize and share data easily.Some key capabilities and benefits of Looker Studio include:Interactive dashboards - Users can...
Looker Studio image
Gephi icon

Gephi

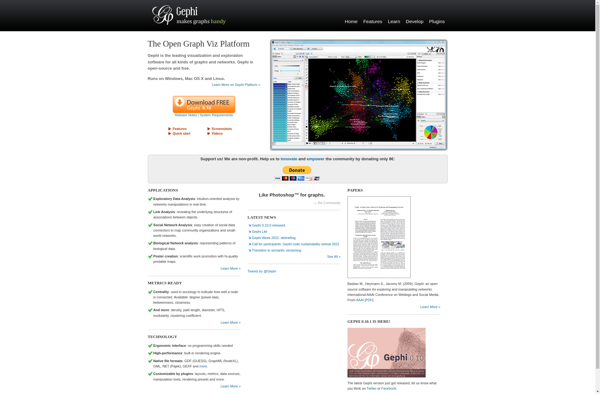
Gephi is an open-source, cross-platform network analysis and visualization software package developed in Java. It allows users to visualize, interactively explore, spatially arrange, manipulate, and statistically analyze network graphs made up of nodes and edges. Gephi provides easy and broad access to complex network data in order to help applied...
Gephi image
Google Charts icon

Google Charts

Google Charts is a robust and flexible JavaScript charting and data visualization library provided for free by Google. It offers developers a highly customizable way to create interactive charts, graphs, and data tables that seamlessly integrate into web pages and applications.With Google Charts, you can visualize complex data sets and...
Google Charts image
Plotly icon

Plotly

Plotly is an open-source graphing library that allows users to create interactive, publication-quality graphs, charts, and dashboards. It supports Python, R, JavaScript, and Excel as programming languages. Some key features of Plotly include:Interactive visualization - Plotly charts are interactive with features like hover text, zooming, panning, selectable legends, and editable...
Plotly image
Redash icon

Redash

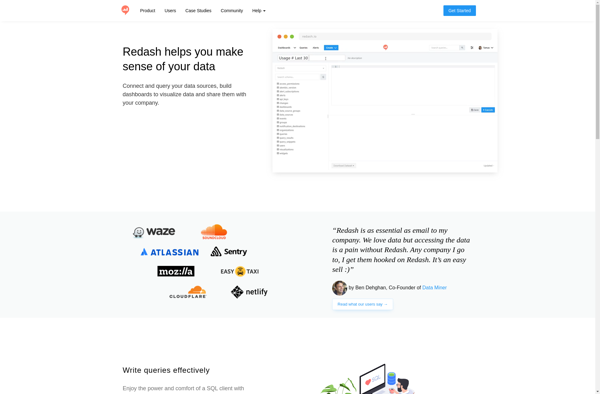
Redash is an open-source business intelligence and data visualization web application. It allows users to connect to multiple data sources including SQL databases, query and visualize the data, and create interactive dashboards to share insights.Some key features of Redash:Connect to data sources like PostgreSQL, MySQL, SQL Server, Redshift, BigQuery and...
Redash image
Databox icon

Databox

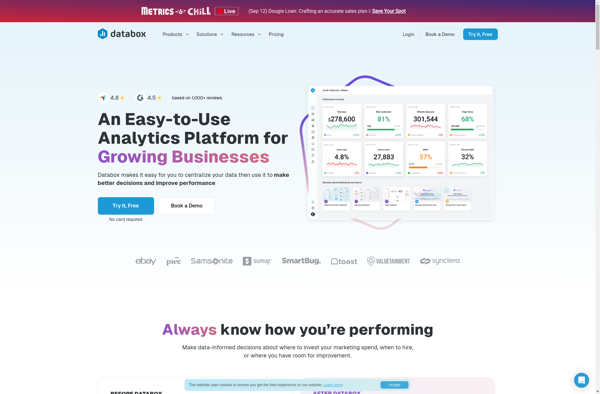
Databox is an open-source personal data platform that enables individuals to manage their personal data securely and privately. Developed by researchers at Imperial College London and the University of Cambridge, Databox allows users to connect data sources like smartphones, wearables, and web apps to feed data into the platform.Once data...
Databox image
RAWGraphs icon

RAWGraphs

RAWGraphs is a free, open-source web tool created for anyone to easily visualize and share data using the most common graphical formats. The simple drag and drop interface makes it easy for non-experts to quickly generate a wide variety of charts and diagrams that can be exported and shared as...
RAWGraphs image