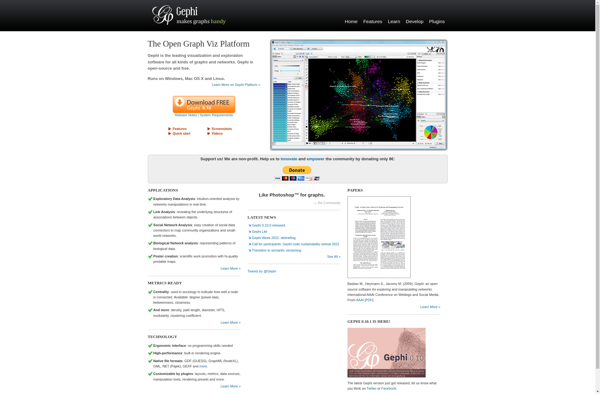
Gephi
Description: Gephi is an open-source network analysis and visualization software package. It allows users to interactively visualize and explore network graphs, run statistical analysis on the structure and content of the networks, and generate high-quality graphical renderings for publications.
Type: software
Pricing: Open Source
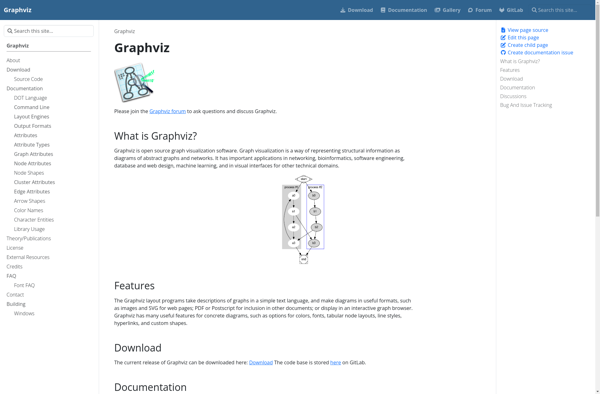
Graphviz
Description: Graphviz is an open source graph visualization software used for representing structural information as diagrams of abstract graphs and networks. It provides useful features for creating a variety of graph types like directed graphs, undirected graphs, hierarchies, and more.
Type: software
Pricing: Open Source