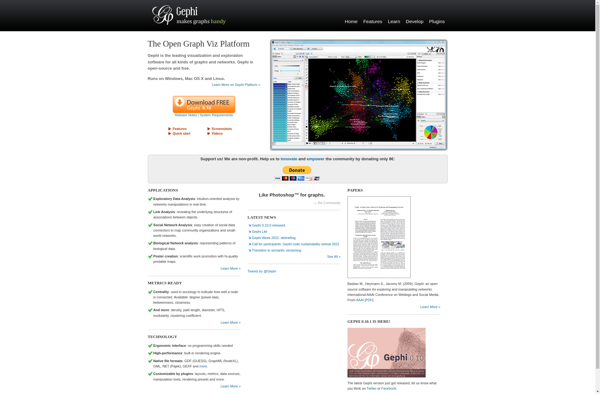
Gephi
Description: Gephi is an open-source network analysis and visualization software package. It allows users to interactively visualize and explore network graphs, run statistical analysis on the structure and content of the networks, and generate high-quality graphical renderings for publications.
Type: software
Pricing: Open Source
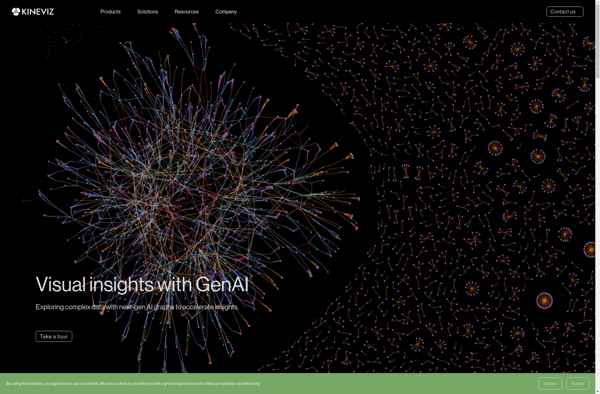
GraphXR
Description: GraphXR is a data visualization and analytics software that allows users to create interactive graphs, charts, and dashboards to gain insights from their data. It has drag and drop functionality to easily build visualizations and has collaboration features to share with teams.
Type: software