GraphThing

GraphThing

GraphThing is a graph and network visualization and analysis software. It allows users to visualize, analyze, and manipulate network graphs with advanced layouts, clustering, and statistic tools. GraphThing is useful for data scientists, researchers, and analysts exploring connec
GraphThing image
graph network-analysis data-science

GraphThing: Graph & Network Visualization

GraphThing is a graph and network visualization and analysis software. It allows users to visualize, analyze, and manipulate network graphs with advanced layouts, clustering, and statistic tools. GraphThing is useful for data scientists, researchers, and analysts exploring connections in data.

What is GraphThing?

GraphThing is a powerful and flexible graph and network visualization and analysis desktop application. It provides advanced capabilities for visualizing, manipulating, and analyzing graph data with intuitive interactive graphs and diagrams.

Key features of GraphThing include:

  • Interactive graph visualization with drag-and-drop editing and pan/zoom control
  • Advanced graph layout algorithms such as force-directed, circular, hierarchical, and more
  • Node and edge formatting options for color, size, labels, icons, and images
  • Analysis tools like degree centrality metrics, clustering algorithms, and more
  • Filtering, searching, clustering, and statistic capabilities
  • Import/export to a variety of common graph formats
  • Customizable user interface with theme support
  • Scripting and extension capabilities for advanced customization

GraphThing is designed for anyone who works with network data, including data scientists, researchers, analysts, and more. It can be used across many industries and use cases such as social network analysis, software architecture mapping, bioinformatics, organizational charts, and more.

GraphThing Features

Features

  1. Interactive graph and network visualization
  2. Advanced graph layout algorithms
  3. Graph clustering and community detection
  4. Graph statistics and metrics
  5. Graph manipulation tools
  6. Data import from various formats
  7. Customizable graph appearance
  8. Collaboration features

Pricing

  • Free
  • Freemium
  • Subscription-Based

Pros

Powerful graph analysis capabilities

Intuitive and customizable interface

Supports wide range of graph formats

Good performance with large graphs

Active development and support

Cons

Steep learning curve

Can be resource intensive for very large graphs

Limited collaboration features in free version

Export options could be better


The Best GraphThing Alternatives

Top Ai Tools & Services and Data Visualization and other similar apps like GraphThing

Here are some alternatives to GraphThing:

Suggest an alternative ❐

Gephi icon

Gephi

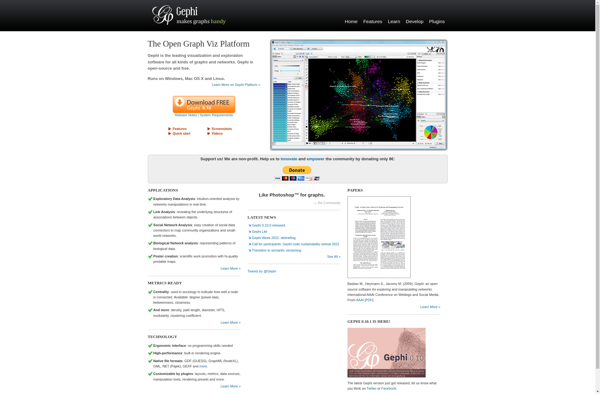
Gephi is an open-source, cross-platform network analysis and visualization software package developed in Java. It allows users to visualize, interactively explore, spatially arrange, manipulate, and statistically analyze network graphs made up of nodes and edges. Gephi provides easy and broad access to complex network data in order to help applied...
Gephi image
SocNetV icon

SocNetV

SocNetV is an open-source, cross-platform application for social network analysis and visualization. It enables researchers to construct social networks with nodes and edges representing actors and relationships between them. SocNetV provides a wide range of network statistics and metrics to analyze the structural properties of social networks.Some key features of...
SocNetV image
JFLAP icon

JFLAP

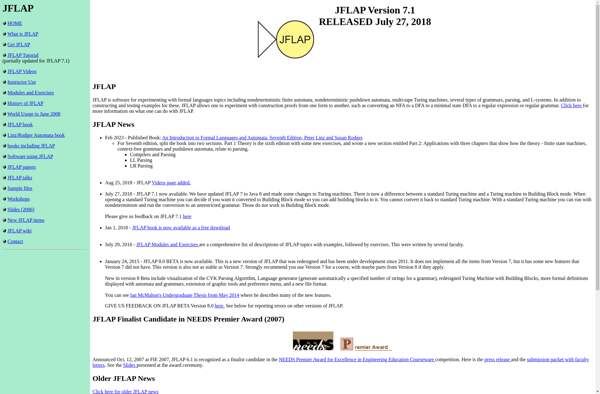
JFLAP (Java Formal Languages and Automata Package) is a free, open-source visual tool and tutorial system for learning and experimenting with concepts in formal languages and automata theory. It allows users to visually create, run, and test systems like finite state automata, pushdown automata, regular expressions, grammars, Turing machines, and...
JFLAP image
Graphynx icon

Graphynx

Graphynx is an open-source, cross-platform software tool for graph and network analysis. It enables users to visualize, analyze, and manipulate different types of graph data structures such as social networks, transportation systems, family trees, and more.Key features of Graphynx include:Interactive graph visualization with support for different layout algorithms such as...
GraphTea icon

GraphTea

GraphTea is an open-source, cross-platform tool for graph and network analysis, visualization, and manipulation. It is implemented in Python and provides a user-friendly graphical user interface for working with graph data.GraphTea allows importing graph data from multiple file formats including GML, GraphML, Pajek NET, CSV, UCInet DL, Matrix Market, and...
GraphTea image
GraphShop icon

GraphShop

GraphShop is a free, open-source vector graphics editor for Windows. It provides a wide range of tools for creating diagrams, charts, illustrations, logos and other graphic designs.It has an intuitive and easy-to-use interface, making it accessible for beginners but also suitable for more advanced users. Some of the key features...
GraphShop image
Jsflap icon

Jsflap

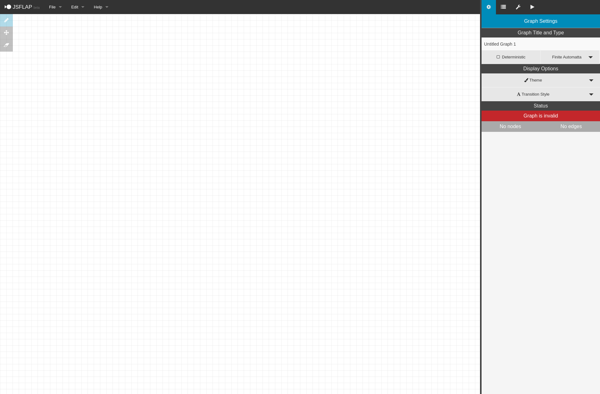
jsflap is a free, open source software application developed for instructors and students to visualize concepts in automata theory and formal languages. It provides a graphical interface for constructing and testing several theoretical machine models including:Finite automataPushdown automataTuring machinesGrammarsSome of the key features include:Intuitive drag-and-drop interface for building machine models...
Jsflap image
Rocs icon

Rocs

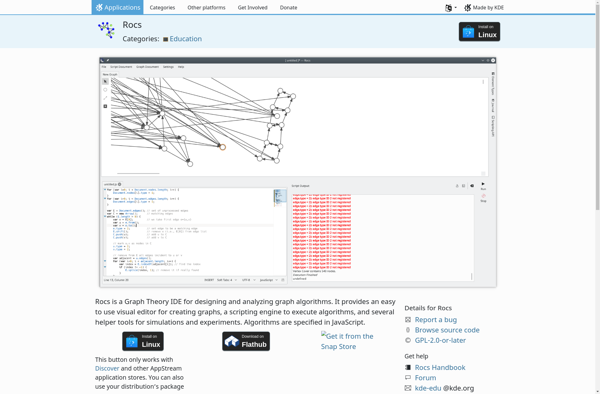
Rocs is an open-source, cross-platform word processor app that serves as an alternative to Microsoft Word. Some key features of Rocs include:Lightweight app with low system resource usageSupport for opening and saving .doc and .docx files for compatibility with Microsoft WordBasic text formatting options like font style, size, color, bold,...
Rocs image