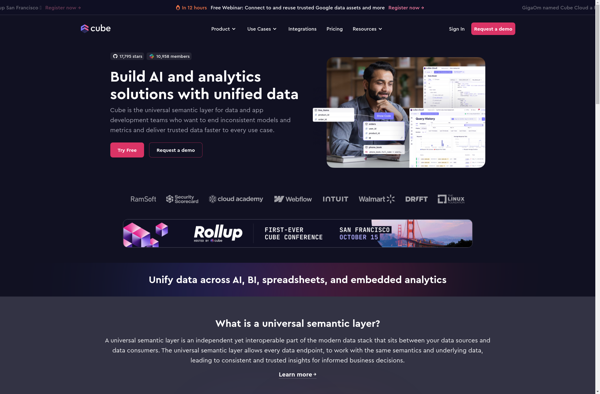
Cube.js is an open-source analytics framework for building cloud-native BI dashboards and applications. It is optimized for fast data aggregation and serves as a headless alternative to services like Tableau or Looker.
An open-source analytics framework for building cloud-native BI dashboards and applications, optimized for fast data aggregation as a headless alternative to services like Tableau or Looker.
What is Cube.js?
Cube.js is an open-source analytics framework for building cloud-native business intelligence dashboards and applications. It provides a flexible way to analyze and visualize data by generating a data model on top of data warehouses or databases.
Some key capabilities and benefits of Cube.js include:
Auto-generating a data schema to power analystics dashboards and visualizations
Support for handling large data volumes and fast aggregation speeds
Integration with visualization libraries like React and Vue for building dashboard front-ends
Deployment flexibility - Cube.js can be containerized and run on Kubernetes, serverless platforms, or other cloud infrastructure
Pre-aggregation and caching for fast query performance even on large datasets
Configuration over code approach that accelerates development
Overall, Cube.js serves as a production-ready standalone analytics backend. It shines for use cases where fast access to analytics over large, streaming data sources is critical. The framework is optimal for building custom analytical applications and dashboards.
Cube.js Features
Features
Pre-aggregations and caching for fast queries
Auto-generated SQL code for querying databases
Client-side JavaScript library for building visualizations
Schema builder for modeling data
Support for joining data from multiple sources
REST API for accessing analytics data
Pricing
Open Source
Cube Cloud (Subscription-Based)
Pros
Very fast query performance
Flexible and extensible data modeling
Open source with active community
Works with multiple data sources
Can be self-hosted or used as a service
Cons
Limited visualization options compared to BI tools
Requires more technical expertise than GUI BI tools
Tableau is a leading business intelligence and data visualization platform used by organizations of all sizes to transform their data into easy-to-understand visualizations and dashboards. With Tableau, users can connect to a wide range of data sources, prepare and clean the data for analysis, and create interactive data visualizations such...
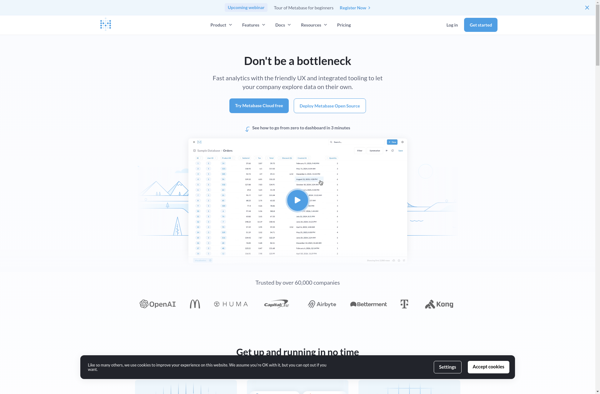
Metabase is an open source business intelligence platform and analytics tool. It allows anyone on a team to ask questions about their data, explore it, and share insights with others through easy-to-create dashboards, charts, and visualizations. Metabase provides an intuitive frontend interface so users can get answers and discover trends...
Redash is an open-source business intelligence and data visualization web application. It allows users to connect to multiple data sources including SQL databases, query and visualize the data, and create interactive dashboards to share insights.Some key features of Redash:Connect to data sources like PostgreSQL, MySQL, SQL Server, Redshift, BigQuery and...
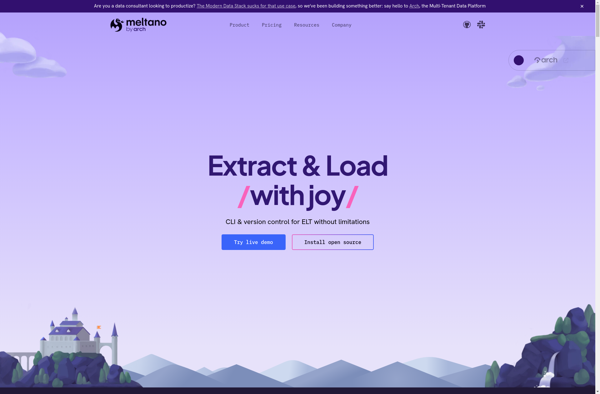
Meltano is an open source data integration and ELT (extract, load, transform) platform aimed at helping data engineers and analysts more easily move, transform, and load data from various sources into data warehouses or visualization platforms. Features include:Visual interface for building data pipelines by connecting data sources, adding transformations, scheduling...
AnswerMiner is an artificial intelligence-powered software that helps companies improve their customer support operations and experiences. It analyzes large volumes of customer service conversation data, including emails, chat transcripts, and call center notes, to provide actionable insights.The key features and benefits of AnswerMiner include:Understanding Frequent Customer Questions and Pain Points:...
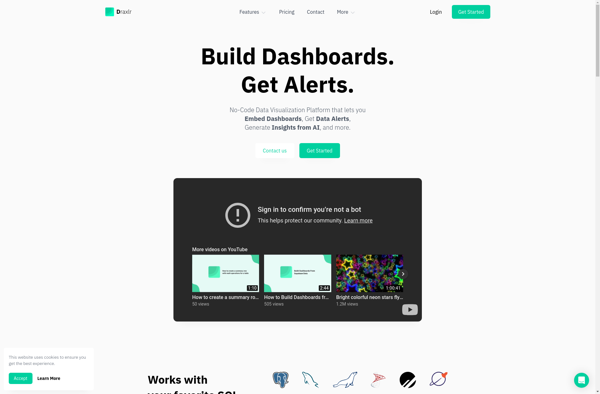
Draxlr is an open-source project management and collaboration tool similar to Trello. It allows you to create boards containing lists and cards to plan tasks and projects.Some key features of Draxlr include:Custom boards with as many columns and cards as you needDrag-and-drop interface to easily reorder cardsMultiple assigned members per...
Marple is an open-source, Markdown-based slide deck tool for creating presentations. It provides a minimalistic editor interface to write slide content in Markdown format, which then gets rendered into an elegant slide deck for presenting.Some key features of Marple:Write slide content in easy-to-read and write Markdown format. Format headings, lists,...
Lightdash is an open-source business intelligence and analytics platform for building interactive dashboards and reports. It allows you to visualize and explore your data to uncover insights and make better decisions.Some key features and capabilities of Lightdash include:Connect to a wide range of data sources like MySQL, PostgreSQL, BigQuery, and...
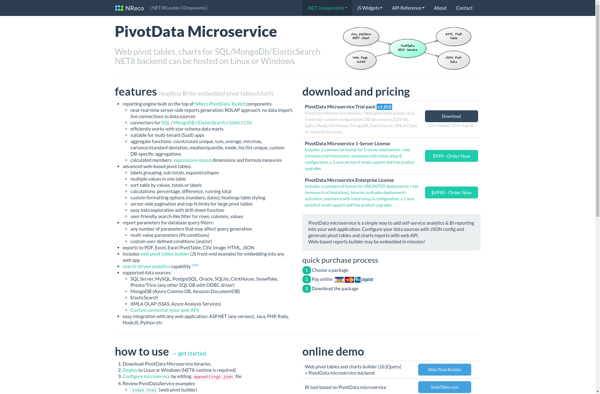
PivotData Microservice is an open-source tool designed for building scalable data aggregation pipelines. It provides a framework for easily ingesting data from multiple sources, transforming and combining it, and exposing aggregated datasets through APIs.Some key capabilities and benefits of PivotData Microservice include:Flexible data ingestion from varied sources like databases, APIs,...
Sisense for Cloud Data Teams is a business intelligence and analytics software platform purpose-built for data teams working with cloud data sources like Snowflake, Databricks, AWS, and Google BigQuery. It aims to make analytics over cloud data easy, accurate, and accessible to everyone.Key capabilities and benefits include:Connectors for leading cloud...